.svg)

.svg)


.svg)


.svg)

.svg)

.svg)

.svg)


Introduction
Thank you for taking the time to read this first edition of the European M&A Monitor. This report consolidates research performed by Dealsuite, the leading European platform for M&A transactions. It contains statistics and trends for the Western-European M&A mid-market (enterprises with a revenue between €1 million and €200 million) over the second half of 2022.
Dealsuite surveyed 1,318 M&A advisory firms operating in the M&A mid-market of the UK&I, DACH, France and the Netherlands.
The aim of this study is to create periodic insights that improve the European market’s transparency and to serve as a benchmark for M&A professionals. We have been publishing local/regional reports for several years now, this is the first time we publish this pan-European report, with a focus on inter-regional differences, as well as similarities. We are convinced that sharing information within our network leads to an improved quality and volume of deals.
Floyd Plettenberg MSc. EMFC
CEO Dealsuite
I Transactions
Slight decrease in the number of buy and sell-side transactions reported.
Figure 1 shows the development of buy and sell-side transactions over H2-2022 compared to H1-2022.
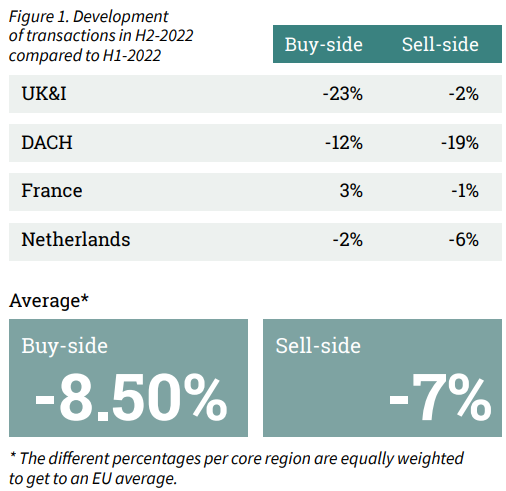
After the turbulent start of 2022, the remainder of the year was also eventful. The ongoing war in Ukraine and the associated increase in inflation and interest rates caused uncertainty and increased risk mitigation measures in the market. The increase in inflation and interest rates also had a negative effect on the selling prices, but the average paid EBITDA multiple decreased by only 0.2 on a European level from an average of 5.4 to 5.2.
In H2-2022, on average, both the buy and sell-side transactions decreased (-8.5% and -7%). Some regions saw a bigger drop in the number of transactions. In France, the buy-side transactions did increase slightly by 3%.
On Dealsuite, the average number of projects per advisor did not significantly change. Overall, the dealflow on the platform went up with 54% compared to 2021. This increase can also be explained by the growth in usage and users.
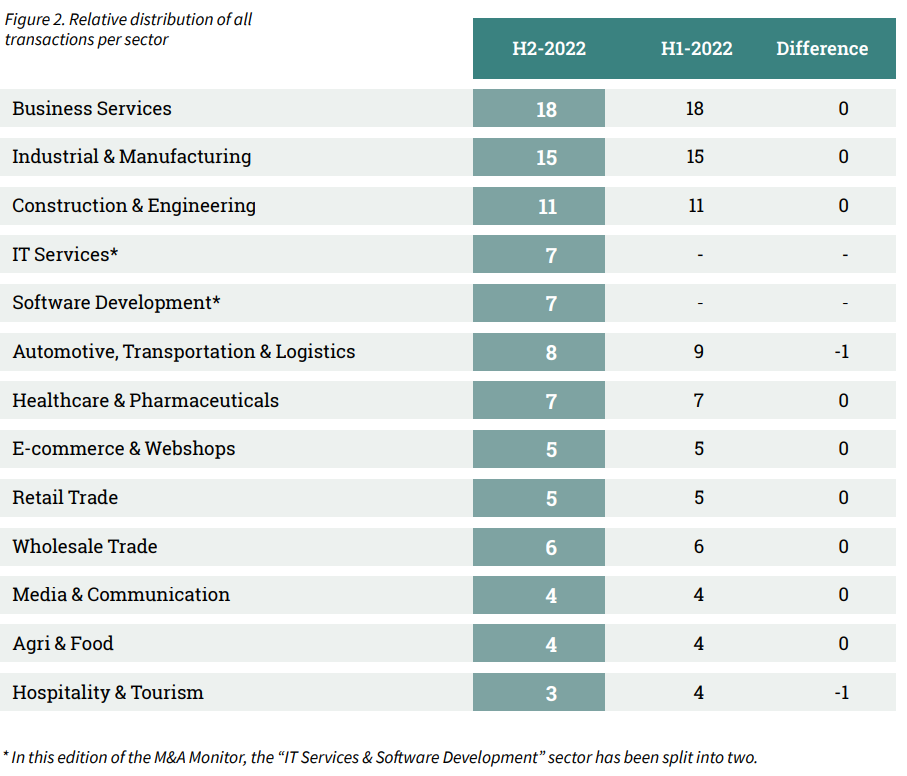
Most transactions in Business Services and Industrial & Manufacturing.
The distribution of transactions completed in H2-2022 across sectors is illustrated in Figure 2. There is a correlation to be expected between the relative size of a specific sector in the mid-market and the percentage of closed transactions. Most transactions were completed in the Business Services and Industrial & Manufacturing sector. Compared to H1-2022, the distribution of transactions has remained similar.
II Sector Multiples per country
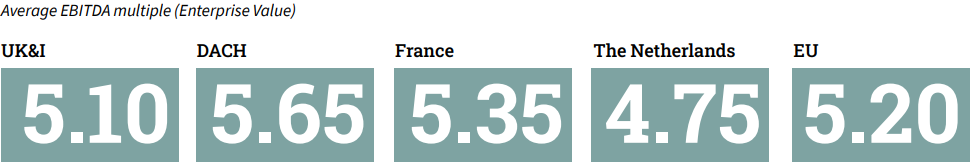
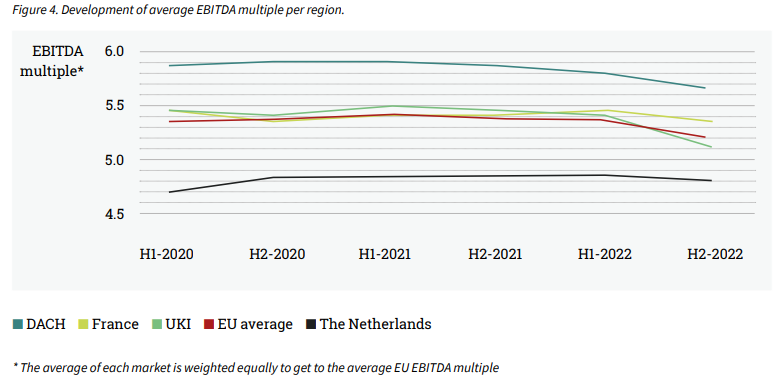
The average EBITDA multiple slightly decreased to 5.2.
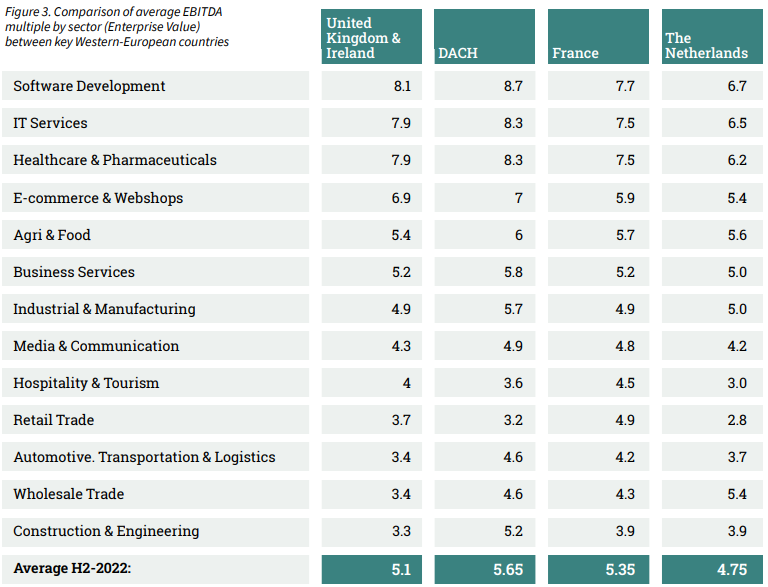
Sell-side advisors defined the average EBITDA multiple by industry. In this edition, we asked to revise the industry multiples from H1-2022. The results are shown in Figure 3.
After a small decrease in H1-2022, the average EBITDA multiple further declined from 5.4 to an average of 5.2. Multiples vary between 2.8 (Retail Trade, NL) and 8.7 (Software Development, DACH). This means that the average price of an SME based on EBITDA can be more than double, depending on the industry.
None of the average EBITDA multiples increased significantly in H2-2022 compared to H1-2022. Instead, most decreased slightly or remained stable. The biggest decrease in multiples was reported in the E-commerce & Webshops sector (-0.2 to -0.5) and Retail Trade (-0.2 to -0.4) depending on the country.
When comparing the average EBITDA multiples of the various Western-European countries, it becomes clear that involving a foreign party in the purchase or sale of a business can bring many benefits. Besides a possible higher selling price, it can also mean finding a transaction partner with a better fit for the business.
In most sectors, UK&I and the Netherlands are showing the lowest EBITDA multiples, while France and the DACH region are showing the highest multiples. A noteworthy difference in average paid EBITDA per sector is in the Healthcare & Pharmaceuticals sector. The average EBITDA multiple for DACH was 8.3 compared to a multiple of 6.2 in the Netherlands.
Furthermore, another big difference in multiples is reported in the Retail Trade sector. In France, an average of 4.9 times the EBITDA was paid for a company in this sector, whereas in the Netherlands, 2.8 times the EBITDA was paid for a similar company.
III Multiple comparison per deal size
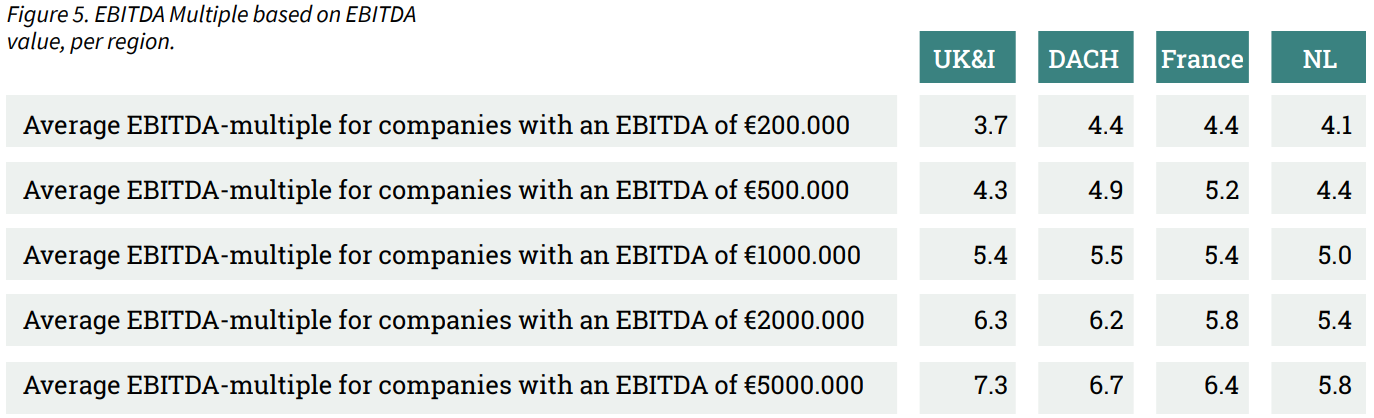
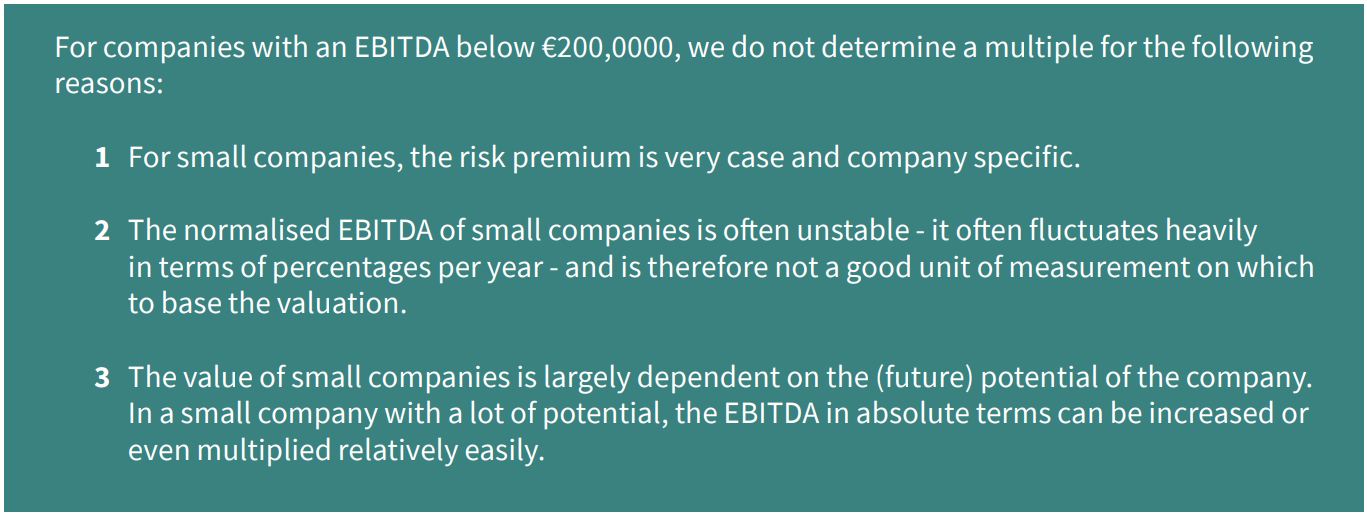
The size of a company can have an influence on the average paid EBITDA multiple. In the M&A Monitors of H1-2021, the impact of the so-called Small Firm Premium on the average EBITDA multiples for SMEs in the various Western-European countries were examined for the first time. Specifically, companies with an EBITDA ranging from €200,000 to €5,000,000 were considered. This EBITDA range is a realistic representation for SMEs in Europe and is therefore used to express the size of a company.
Research has shown that the smaller a company is, the greater the chance that the expected cash flows will not be realised (Damodaran, 2011; Grabowski and Pratt, 2013). Consider, for example, the dependency on certain customers or suppliers, or the dependency on specific technical know-how that can quickly diminish when staff leave. This can have a significant impact on the returns and thus on the value of a company. The higher risk premium that applies to smaller companies (the so-called Small Firm Premium) causes a value-reducing effect. As a result, the EBITDA multiples paid for larger companies are on average higher than the multiples paid for smaller companies.
The results of this monitor survey confirm again that companies with a low EBITDA have a lower multiple than companies with a high EBITDA. The influence of company size on EBITDA multiples paid is presented in Figure 5.
IV Offer per buyer type
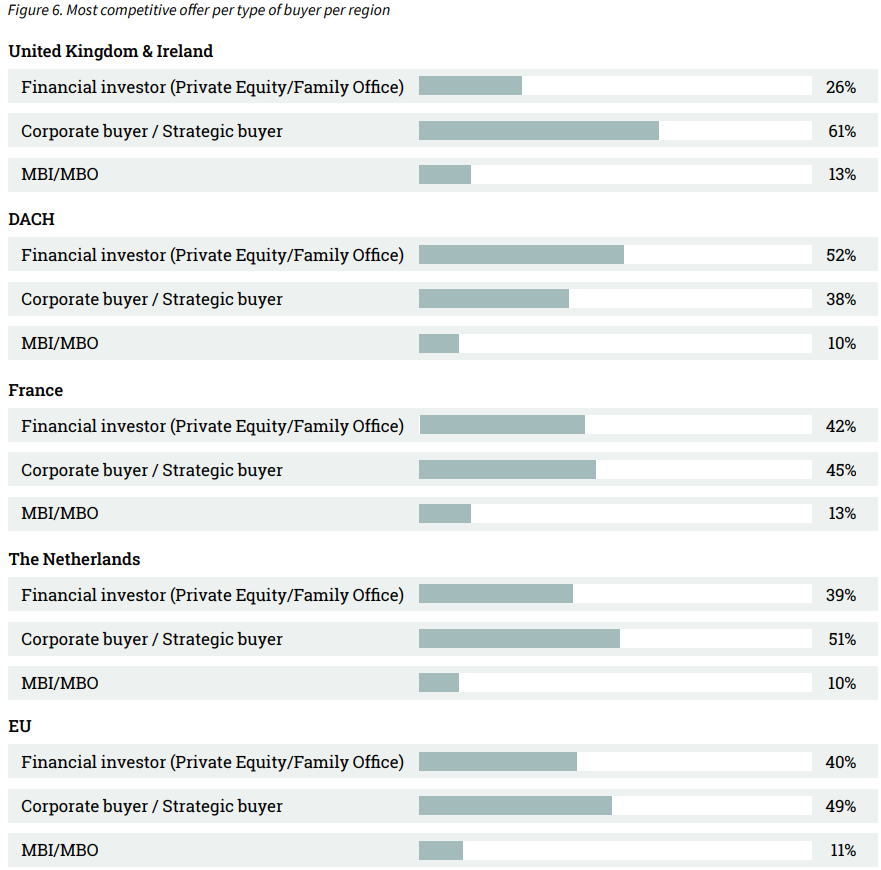
On average a corporate buyer or strategic investor makes the most competitive offer (49%).
In this edition of the M&A Monitor, the advisors were asked what type of buyer is willing to make the highest offer, as a percentage of the total number of transactions. The results can be found in Figure 6.
By comparing the most competitive offer per type of buyer per region, it can be beneficial to check what type of buyer is interesting to consider in certain regions. If you for example are looking for a financial investor for a company in the UK&I, you may consider offering it to financial investors abroad.
V Outlook
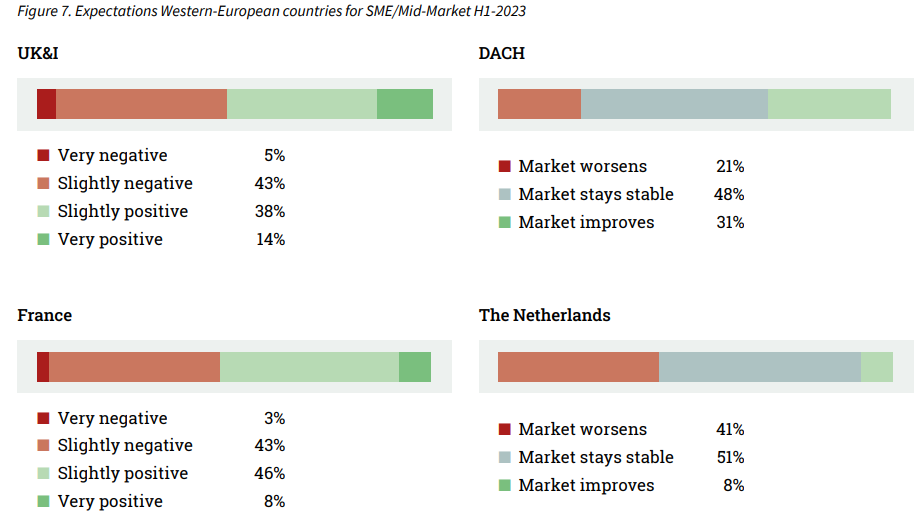
The majority of advisors expect stabilisation or improvement of the market in H1-2023.
Assessing the performance of the Western-European SME and mid-market is based on many factors, including the willingness of entrepreneurs to sell their businesses, funding availability, macroeconomic developments etc. A complex interpretation of these factors is needed to determine how the market will develop. Our survey included assessment of the M&A mid-market in H1-2023 (projection).
In all markets, the majority of respondents expect the market to stay stable or to improve. The most optimistic is the DACH market, where 48% expects stabilisation and 31% expects the market to improve.
VI Method
The majority of M&A transactions take place in the mid-market. This M&A Monitor uses the definition of a mid-market company as having a revenue between 1 and 200 million euros. The survey that was the basis for this M&A Monitor was sent to 1,318 M&A advisory firms. Considering their combined input, they represent an essential part of the M&A mid-market in Western-Europe. Out of the total of 1,318 advisory firms, we received in total 486 responses (36.9% response rate).
Sources used:
• 486 survey responses from key Western-European M&A advisory firms
• Dealsuite M&A Monitors 2015 - 2022
• Dealsuite transaction data 2015-2022
• Damodaran (2011). Equity Risk Premiums (ERP).
This research was conducted by Jelle Stuij, Bjorn Brenninkmeijer and Roos Bijvoet. For further questions, please contact Maarten Reinders, CCO Dealsuite.