.svg)

.svg)


.svg)


.svg)

.svg)

.svg)

.svg)


Introduction
Thank you for taking the time to read this February 2023 version of the UK&I M&A Monitor. This report consolidates research performed by Dealsuite, the leading UK&I and international platform for M&A transactions. It contains statistics and trends for the UK&I M&A mid-market (enterprises with a revenue between £1 million and £200 million) over the second half of 2022.
Dealsuite surveyed 327 M&A advisory firms operating within the UK&I M&A mid-market.
The aim of this study is to create periodic insights that improve the UK&I market’s transparency and to serve as a benchmark for M&A professionals. We are convinced that sharing information within our network leads to an improved quality and volume of deals.
Floyd Plettenberg MSc. EMFC
CEO Dealsuite
I Transactions
Significant drop in number of buy-side transactions
The advisors that took part in this research were involved in the following number of transactions in the second half of 2022:
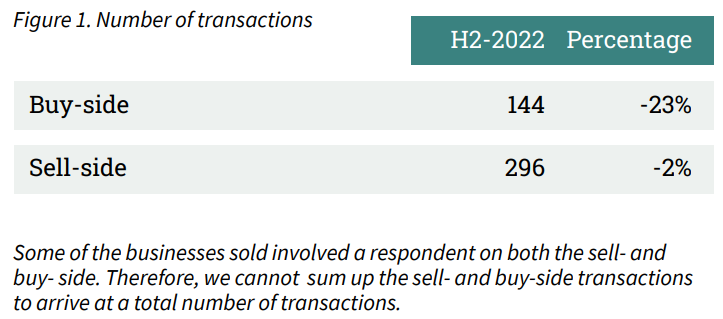
In the second half of 2022, the M&A-market suffered from unstable economic conditions. Partly due to rising inflation and interest causing a slowdown in M&A activity. In the United Kingdom and Ireland, a significant decrease in buy-side transactions was reported for H2-2022.
Following an increase in transactions in H1-2022, the number of sell-side transactions slightly dropped by 2% in H2-2022. More significant is the the reported decrease in the number of buy-side transactions. Compared to H1-2022, this number dropped by 23% in H2-2022.
Most transactions completed in the Business Services sector. Increase in the share of transactions in the sector Media & Communications.
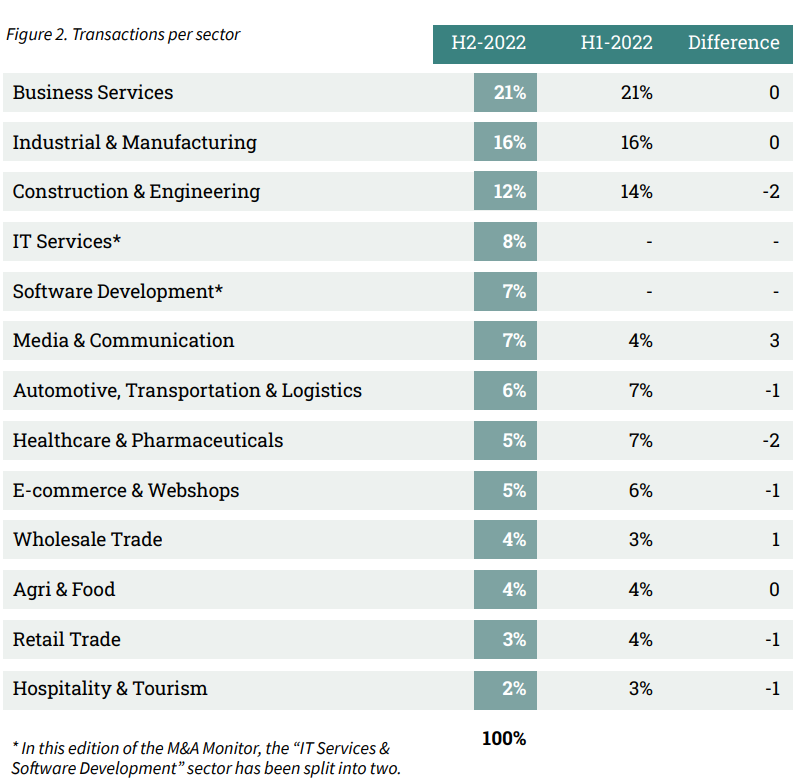
The distribution of transactions completed in H2-2022 across sectors is illustrated in Figure 2. In this edition of the M&A monitor, the IT-services & Software Development sector has been split into two. With increased digitalization and the pace of development within the IT and Software sector, it serves our research to differentiate between companies with different characteristics.
Compared to H1-2022, the distribution of transactions per sector has remained similar in H2-2022. Again, most transactions were completed in the Business Services sector (21%). After it had doubled in H1-2022, the percentage of transactions completed in the Agri & Food sector remained stable at 4%.
The most significant change in transaction percentage was reported in the Media & Communication sector, with the percentage of completed transactions in this sector rising to 7%. 11% of transactions were completed in the sector IT Services & Software Development in H1-2022. Now that the sector has been split into two, 8% of transactions were completed in the IT Services sector and the Software Development sector counts for 7% of the total completed transactions.
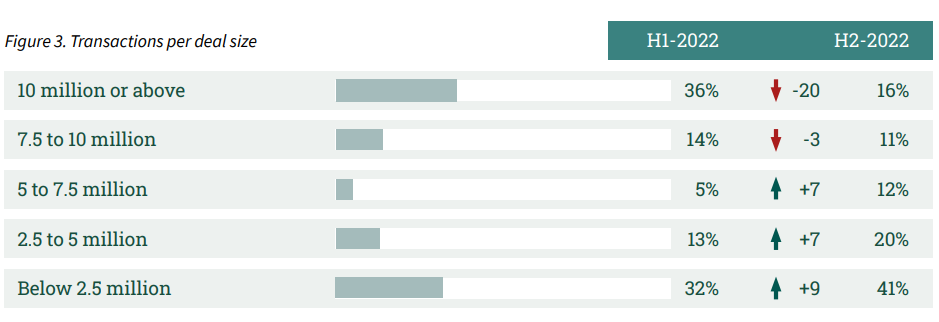
Increase in transactions with a deal size below 2.5 million.
Following on from a number of periods where the average deal size increased, the average deal size in H2-2022 has slightly decreased. 27% of transactions still had a deal size of more than 7.5 million, compared to 50% in H1-2022. In H1-2022, 29% of transactions had a deal size of less than 2.5 million. This percentage has increased to 41% in H2-2022.
II Assignments
54% of advisors report an increase in assignments.
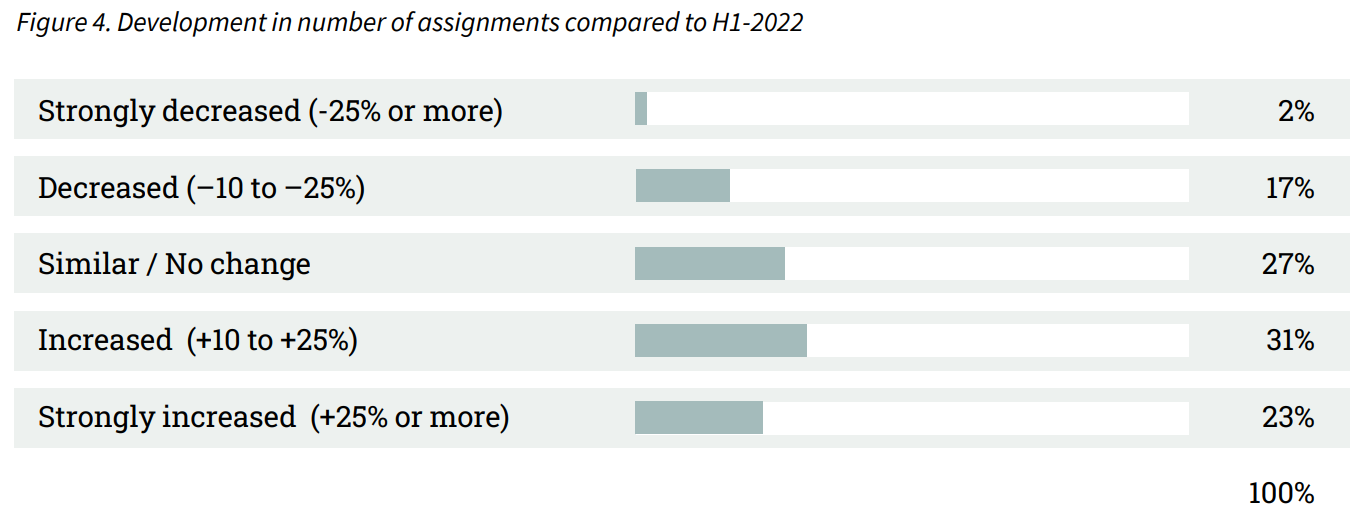
The results are explained in more detail in Figure 4 below. These are assignments received in H2-2022 and completed in H2-2022, however, it is worth noting that some of these projects may be completed during a later period or cancelled altogether.
Despite the turbulent M&A-market, 54% of advisors report an increase in assignments. Compared to H1-2022, this is a slowdown in the increase of assignments. 19% of advisors did report a drop in assignments and 27% of advisors did not experience a big change.
III Sector Multiples
The average EBITDA multiple decreased to 5.1.
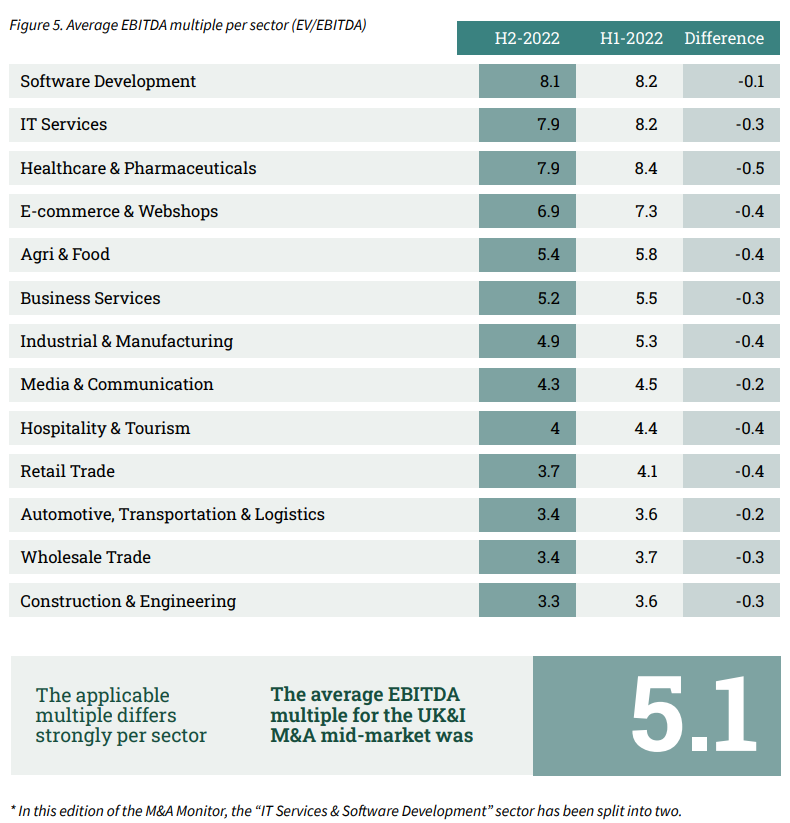
Sell-side advisors defined the average EBITDA multiple by industry. In this edition, the advisors were asked to revise the industry multiples from H1-2022. The results are shown in Figure 5.
In this edition of the M&A monitor, the average EBITDA multiple across all sectors was reported as 5.1. The multiples vary from 3.3 (Construction & Engineering) to 8.1 (Software Development).
All sectors noted a decrease in EBITDA multiple. The biggest decrease in EBITDA multiple was reported in the Healthcare & Pharmaceuticals sector. The multiple dropped from 8.4 in H1-2022 to 7.9 in H2-2022.
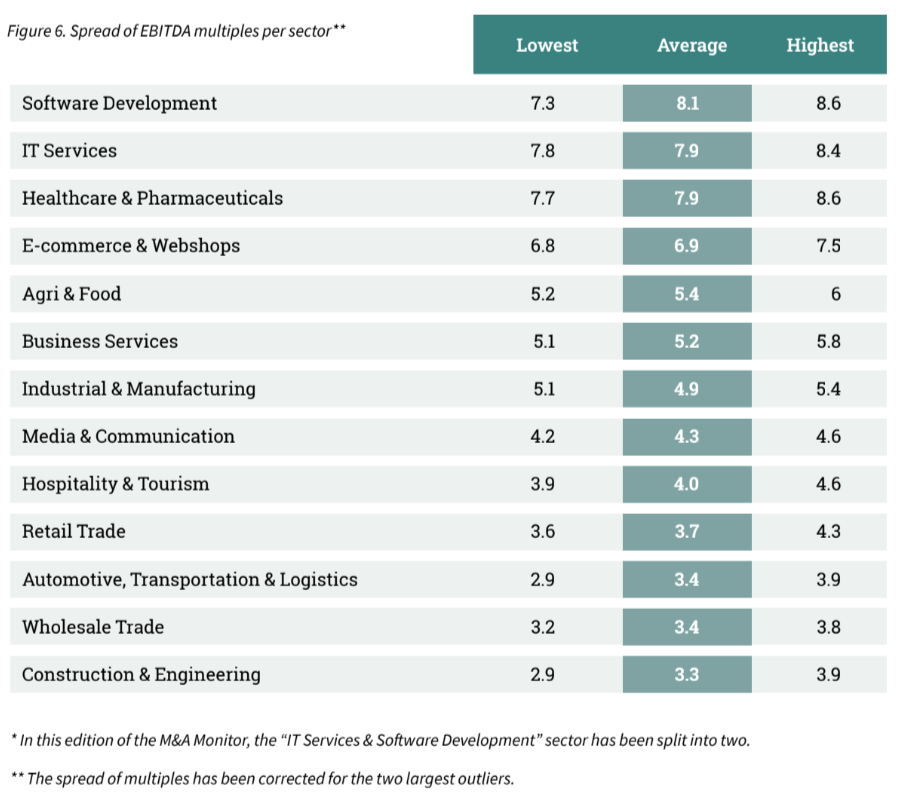
Biggest spread reported in the Software Development sector.
Sectors contain various types of companies with different characteristics. As a consequence, businesses in a specific sector may also vary more strongly from the average EBITDA multiple than in other sectors. Figure 6 shows the spread of EBITDA multiples per sector. For some sectors, a wider spread in EBITDA multiples is reported, compared to sectors that contain a higher proportion of similar companies.
IV Multiples in relation to company size
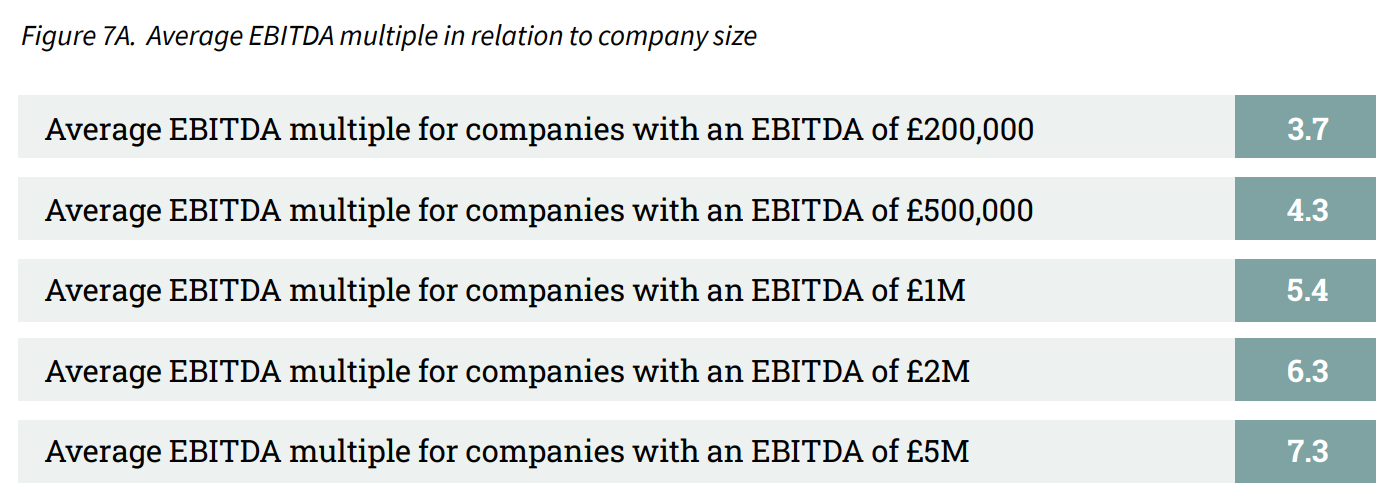
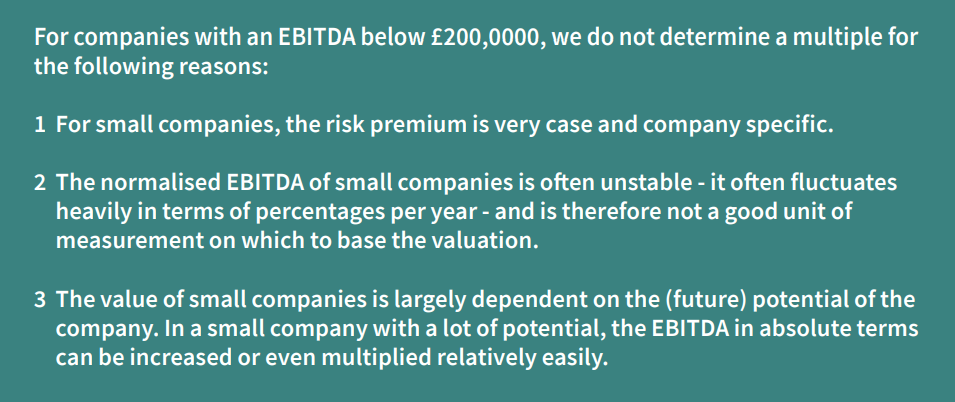
The size of a company can have an influence on the average paid EBITDA multiple. In the M&A Monitor of H1-2021, the impact of the so-called Small Firm Premium on the average EBITDA multiples for SMEs in the United Kingdom was examined for the first time. Specifically, companies with an EBITDA ranging from £200,000 to £5,000,000 were considered. This EBITDA range is a realistic representation for SMEs in the United Kingdom and Ireland and is therefore used to express the size of a company.
New research has shown that the smaller a company is, the greater the chance that the expected cash flows will not be realised (Damodaran, 2011; Grabowski and Pratt, 2013). Consider, for example, the dependency on certain customers or suppliers, or the dependency on specific technical know-how that can quickly diminish when staff leave. This can have a significant impact on the returns and thus on the value of a company. The higher risk premium that applies to smaller companies (the so-called Small Firm Premium) causes a value-reducing effect. As a result, the EBITDA multiples paid for larger companies are on average higher than the multiples paid for smaller companies.
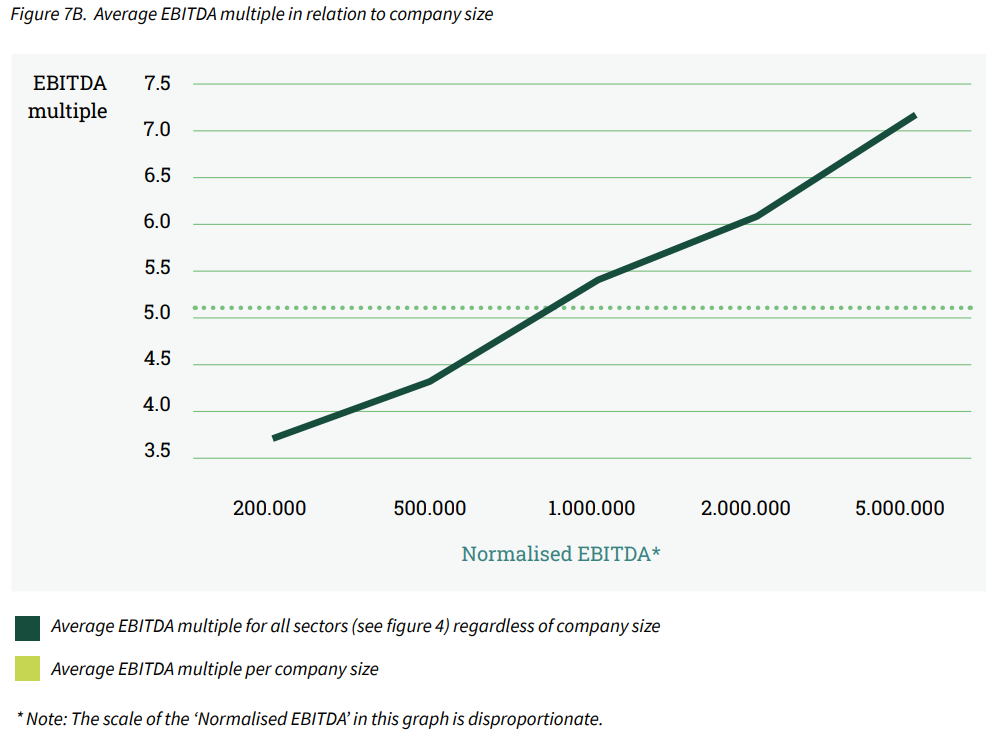
The results of this monitor survey confirm again that companies with a low EBITDA have a lower multiple than companies with a high EBITDA. The influence of company size on EBITDA multiples paid is presented in Figures 7A and 7B.
The difference in the EBITDA multiple between companies with a normalised EBITDA of £200,000 and £5,000,000 is 3,5 (3.7 compared to 7.2). That is a difference of 51%.
V Cross-border transactions
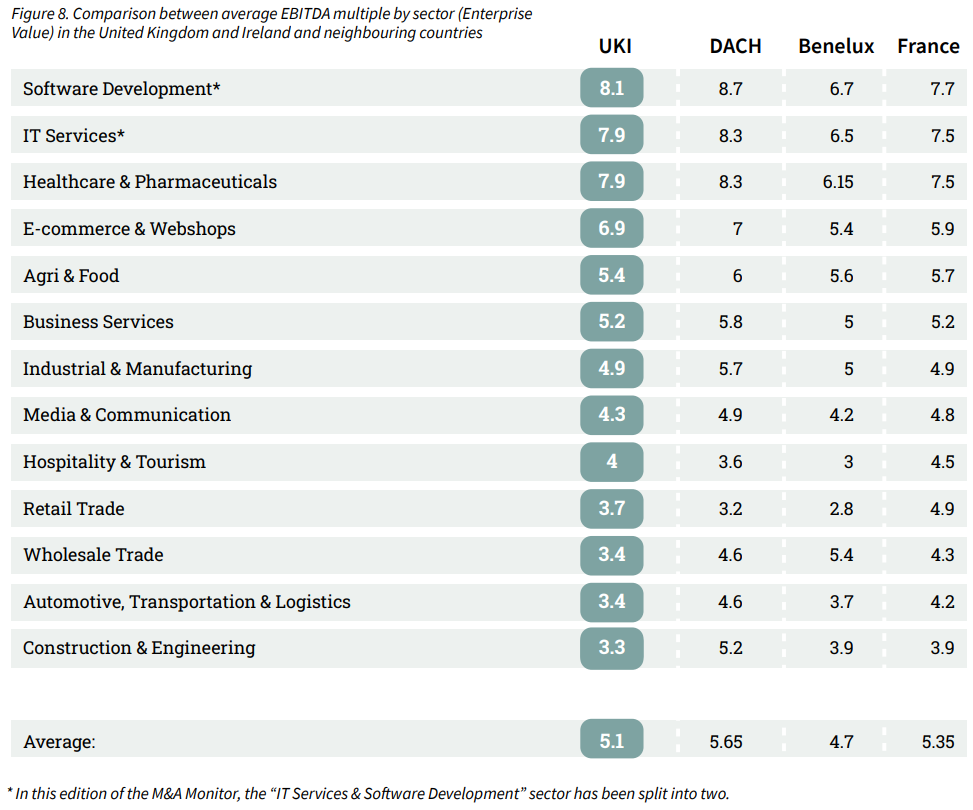
A comparison of EBITDA multiples between different countries highlights the advantages of cross-border deals. For example, it can be beneficial to buy a particular company abroad, or to sell a company to an international buyer. Figure 8 shows the differences in EBITDA multiples between Western European markets.
An example of a significant difference in average EBITDA multiples is seen in the comparison between the Construction & Engineering multiple for UKI (3.3) and the multiple for a similar company in the DACH region (5.2). This difference in multiples of 1.9 shows in order to achieve a higher selling price.
The comparison of the multiple for the Healthcare & Pharmaceuticals sector with the multiple for the Benelux further emphasises the benefits of acquiring abroad.
In all four countries/regions, the highest paid EBITDA multiple is reported in the Software Development sector.
VI Offer per buyer type
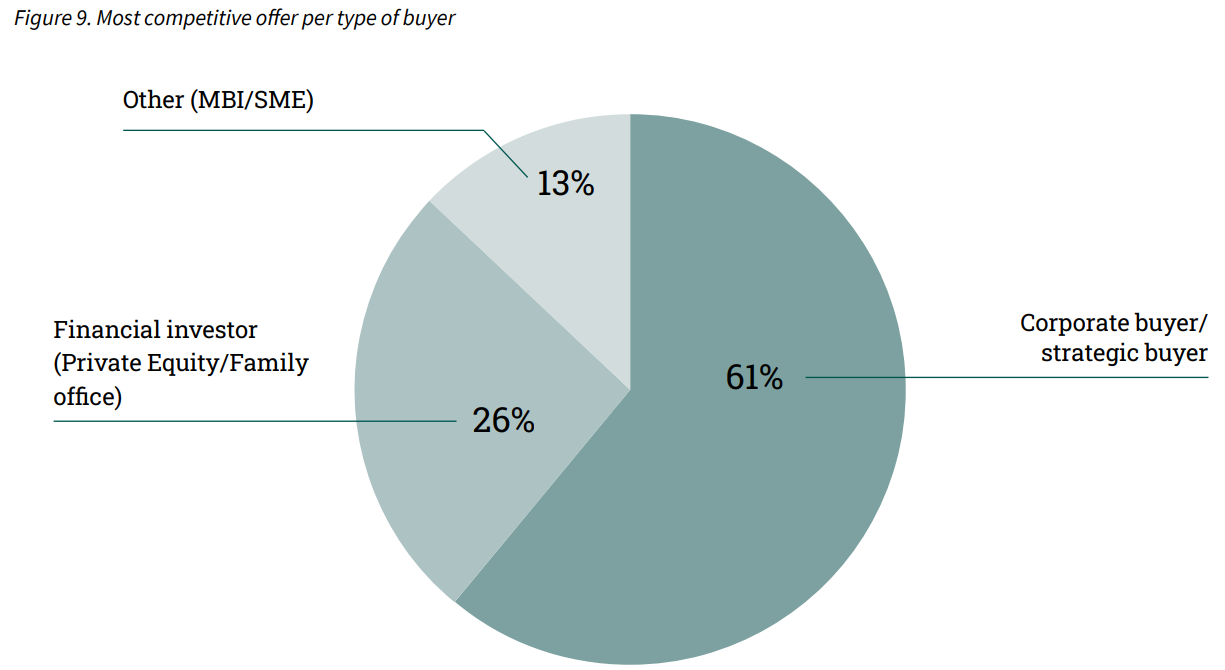
In most of the cases, a strategic buyer is offering the highest price.
The most competitive offer is one of the motivations for choosing a particular type of buyer.
In this edition of the M&A Monitor, the advisors were asked what type of buyer is willing to make the highest offer, as a percentage of the total number of transactions. The results can be found in Figure 9.
In only 13% of the cases, the highest offer is not made by an investment firm or strategic buyer.
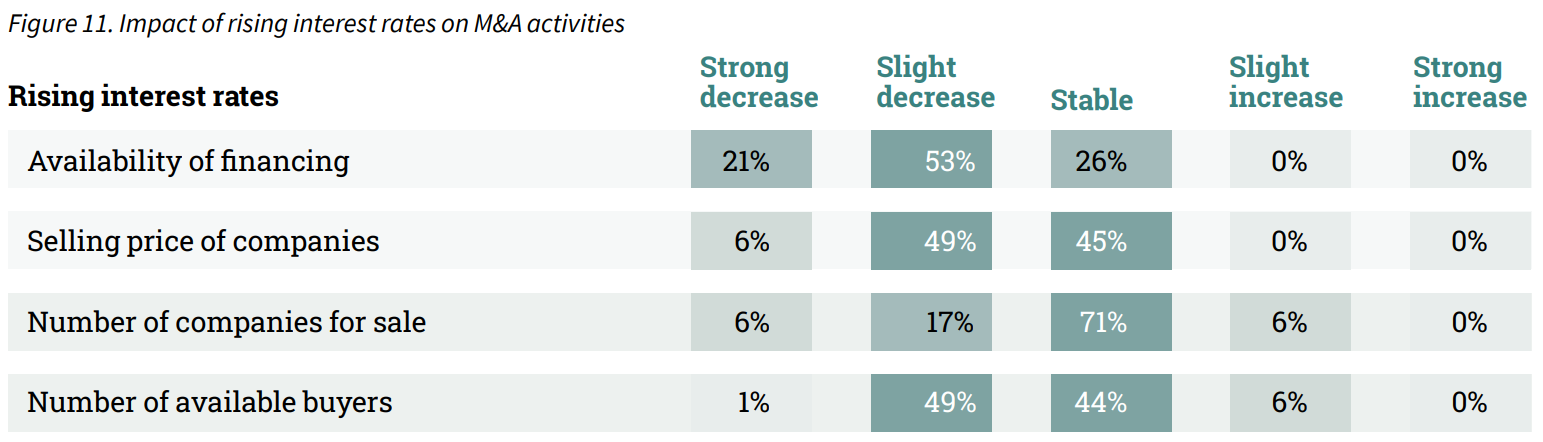
VII Inflation and increase in interest rates
The United Kingdom and Ireland are experiencing the strongest inflation in over 20 years (Statista, 2022). In H1-2022, the advisors were asked to express the impact of the inflation on their M&A activity. The advisors were also asked about the impact of the subsequent increase in interest rates by the ECB and Bank of England.
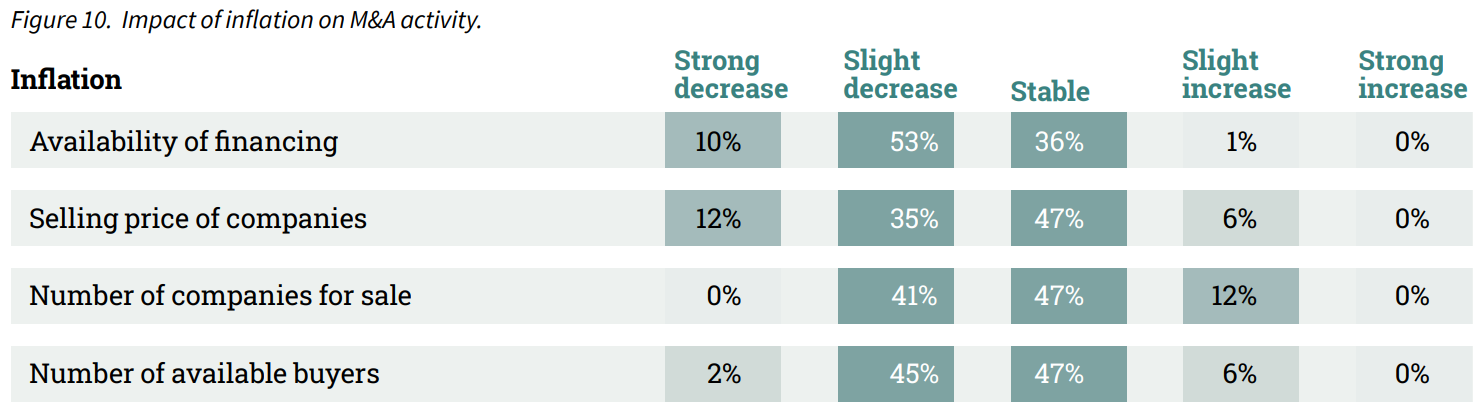
As the impact of the inflation and interest rates has become more visible in H2-2022, the surveyed advisors were again asked to examine the impact on their M&A activities. The increase in inflation and interest rates, among other things, all can have an influence on the availability of financing, selling price of companies, the number of companies for sale and the number of available buyers. The results of the survey can be found in Figure 10 and Figure 11.
Compared to H1-2022, the impact of inflation on M&A activity has become more visible. For instance, in H1-2022, 43% of advisers reported a drop in the availability of financing. In H2-2022, the majority of the advisors reported a drop (63%). 47% of advisers report a decline in the number of available buyers, in H1-2022, this percentage was 21%.
After a number of interest rate increases by the ECB or the Bank of England in 2022, the impact of the
increased interest rates on the M&A activities of advisors was once again examined. In H2-2022, over half of the advisors reported a drop in the number of available buyers (51%). In H1-2022 a drop of 18% was reported.
In H1-2022, 36% of advisors reported a drop in the selling price of companies. In H2-2022, 55% reported a drop. The majority of advisors, 71%, do not experience a difference in the number of companies for sale.
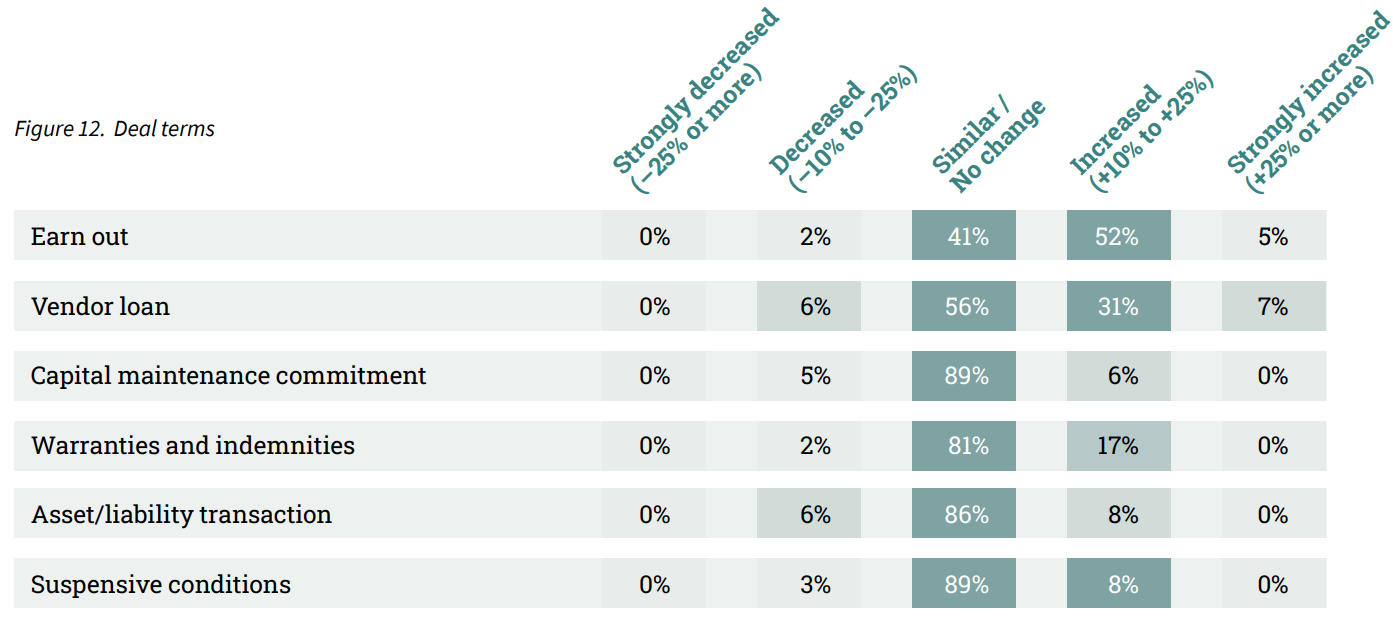
VIII Deal terms
Macroeconomic developments may affect the use of specific deal terms. In this edition of the M&A Monitor, research is done on the use and frequency of different deal terms. The results can be seen in Figure 11.
In H2-2022, there was a significant increase in the number of times an earn out or vendor loan was applied in a transaction. An increase of 17% was reported for the times warranties and indemnities were applied. There was no significant difference in the times the other deal terms were applied.
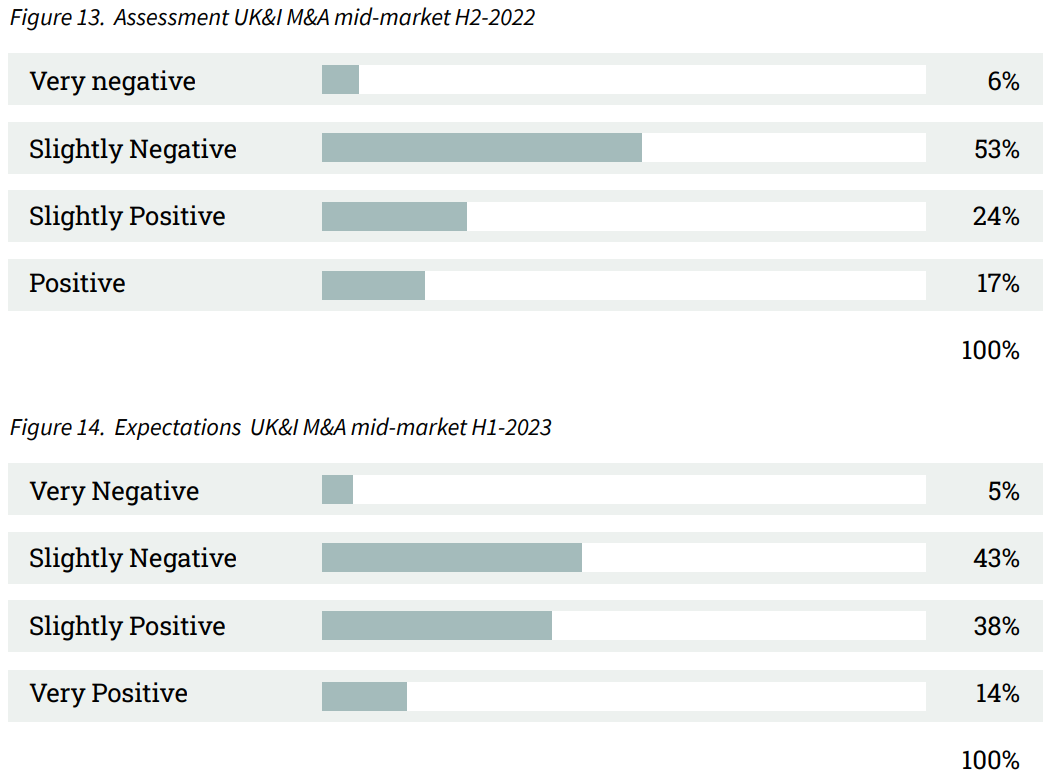
IX Outlook
52% of advisors are optimistic about H1-2023.
Assessing the performance of the UK&I M&A mid-market is based on many factors, including the willingness of entrepreneurs to sell their businesses, funding availability, macroeconomic developments etc. An interpretation of these factors is needed to determine how the market will develop. The survey included both assessments of the M&A mid-market in H2-2022 (retrospective) and H1-2023 (projection).
The majority of advisors look back negatively at the performance of H2-2022 (59%). Despite the turbulent economic conditions, 41% of advisors look back at H2-2022 with a sense of satisfaction. The expectations for H1-2023 are mixed, with 52% of advisors expressing positive expectations.
X Method
The majority of M&A transactions take place in the mid-market. This M&A Monitor uses the definition of a mid-market company as having a revenue between 1 and 200 million pounds. The survey that was the basis for this M&A Monitor was sent to 327 M&A advisory firms. Considering their combined input, they represent an essential part of the M&A mid-market in the UK&I. Out of the total of 327 advisory firms, we received 104 respondents (31.8% response rate).
Sources used:
• 104 survey responses from senior managers of UK&I M&A advisory firms
• Dealsuite M&A Monitors 2015 - 2023
• Dealsuite transaction data 2015-2022
• Field, A. (2011) Discovering Statistics SPSS. Third edition, SAGE publications, London. 1 -822
• Grabowski and Pratt (2013). Cost of Capital: Applications and Examples.
• Statista. 2022. Inflation rate from 1987 to 2027 | Statista.
• Damodaran (2011). Equity Risk Premiums (ERP).
This research was conducted by Jelle Stuij, Bjorn Brenninkmeijer and Roos Bijvoet. For further questions,
please contact Tariq Mooseajee or Edward Playfair.