.svg)

.svg)


.svg)


.svg)

.svg)

.svg)

.svg)

Introduction
Thank you for taking the time to read this H2-2021 version of the UK&I M&A Monitor. This report consolidates research performed by Dealsuite, the leading UK&I and international platform for M&A transactions. It contains statistics and trends for the UK&I M&A mid-market (enterprises with a revenue between £1 million and £200 million) over the second half of 2021.
Dealsuite surveyed 323 M&A advisory firms operating in the UK&I M&A mid-market.
The aim of this study is to create periodic insights that improve the UK&I market’s transparency and to serve as a benchmark for M&A professionals. We are convinced that sharing information within our network leads to an improved quality and volume of deals.
I Transactions
Small decrease in average number of buy-side transactions. Average number of sell-side transactions continued to increase.
The advisors that took part in this research were involved in the following numbers of transactions in the second half of 2021:
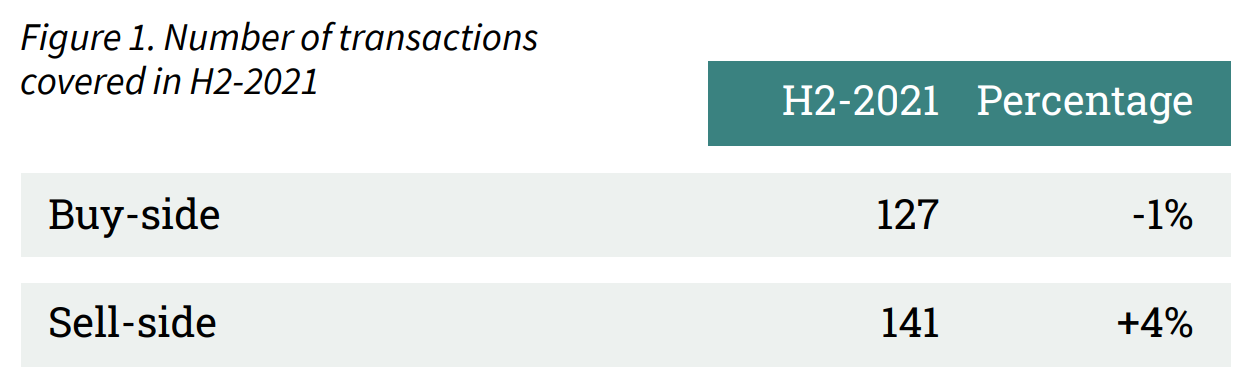
Some of the businesses sold involved a respondent on both the sell- and buy- side. Therefore, we cannot sum up the sell- and buy-side transactions to arrive at a total number of transactions.
The year 2020 was marked by Covid-19, the government’s restrictive measures and their impact on the economy and society. The impact on the M&A market in UK&I was visible in a substantial decrease in both buy- and sell-side transactions in 2020. The first half of 2021 was marked by recovery and growth in the M&A market in the United Kingdom and Ireland. In the second half of 2021, the average number of transactions stabilized with an increase of 4% on the sell-side and a decrease of 1% on the buy-side.
I Transactions
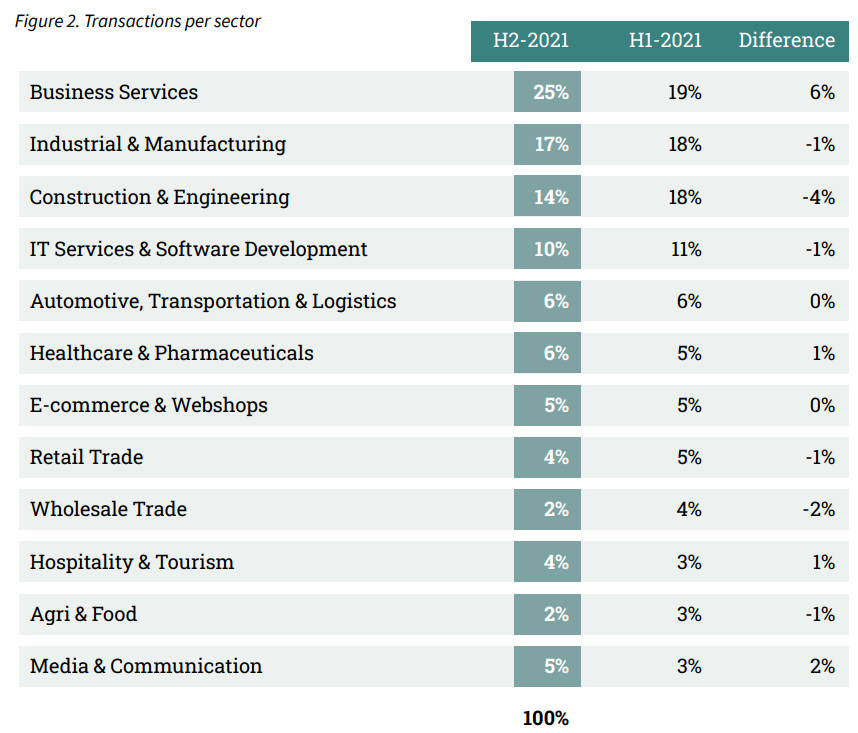
Strong increases in transactions within Business Services and Media and Communication.
The distribution of transactions in H1-2021 across the sectors is illustrated in Figure 2. Just like in previous editions, most transactions were reported in the Business Services sector. In H2-2021, one out of four transactions was reported within the Business Services sector. An increase of 6% compared to H1-2021. The media and communication sector increased significantly from 3% in H1-2021 to 5% in H2-2021.
In H1-2021, significant increases in the sectors Industrial & Manufacturing and Construction & Engineering were reported. Transactions in the sector Industrial & Manufacturing increased from 12% in H2-2020 to 18% in H1-2021. An increase of 7% was reported in the Construction and Engineering sector. In the second half of 2021, a small decrease in transactions was reported in both sectors.
Following a period of stability in the share of transactions within the sector Hospitality & Tourism, uncertainty in this sector seemed to be suppressing the number of transactions. This sector has decreased from 8% in H2-2020 to 3% in H1-2021. With the recovery of the Covid-19 situation in the second half of 2021, a small pick up of 1% was reported.
I Transactions
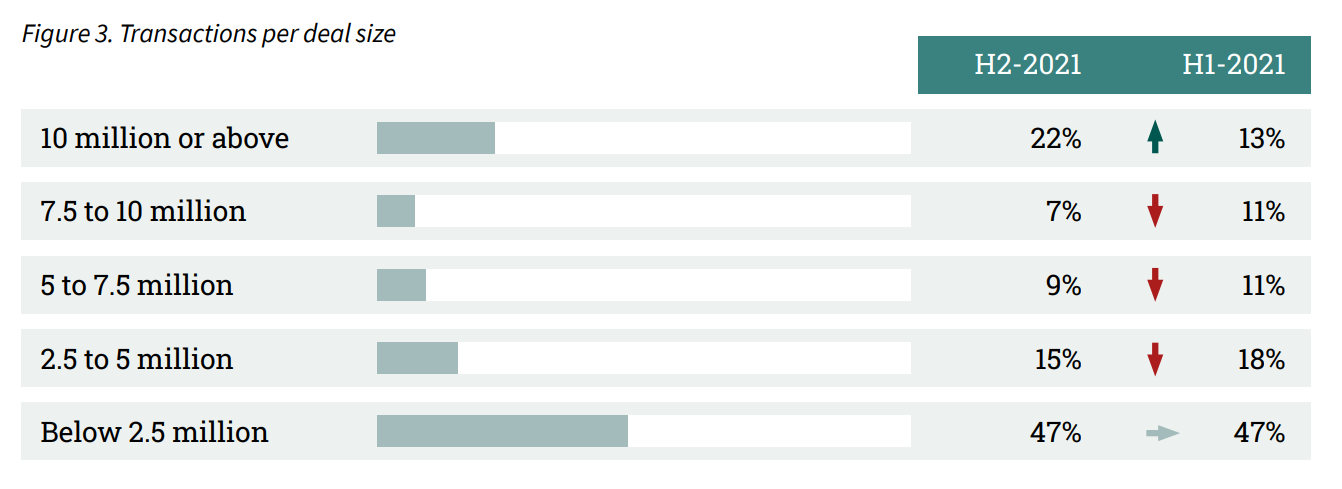
Significant increase in transactions with a dealsize of over 10 million.
In H2-2021 the average dealsize increased. In H1-2021 35% of transactions had a dealsize of over 5 million, compared to 38% in H2-2021.
II Assignments
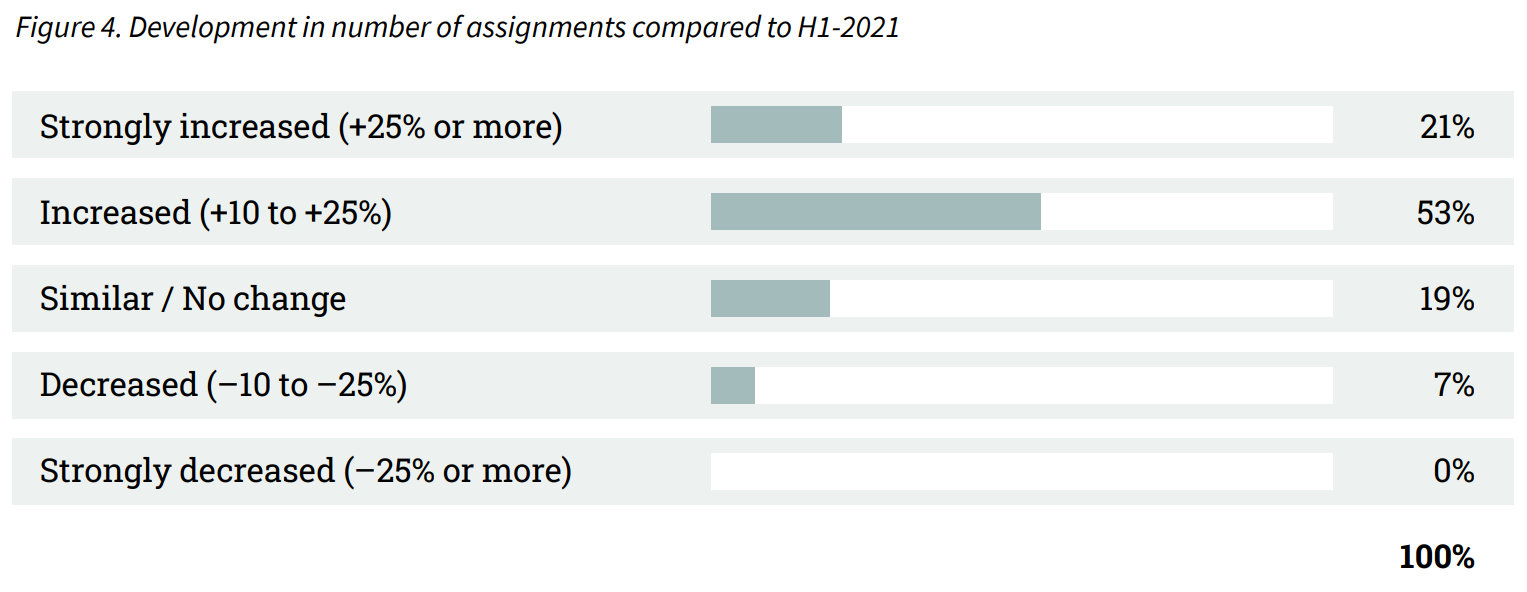
Three out of four advisors (74%) report an increase in assignments of at least 10%
The results are explained in more detail in Figure 4 below. These are assignments received in H2-2021 and completed in H2-2021, but they may also take till H1-2022 to close or be aborted altogether.
The number of advisors reporting a decrease in assignments already dropped from 31% in H2-2020 to 8% in H1-2021, and further decreases to 7% in the second half of 2021. Indicating a significant market recovery. 21% of advisors report a sharp increase in assignments of 25% or more. Not a single respondent reported a significant decrease in their assignment portfolio.
III Sector Multiples
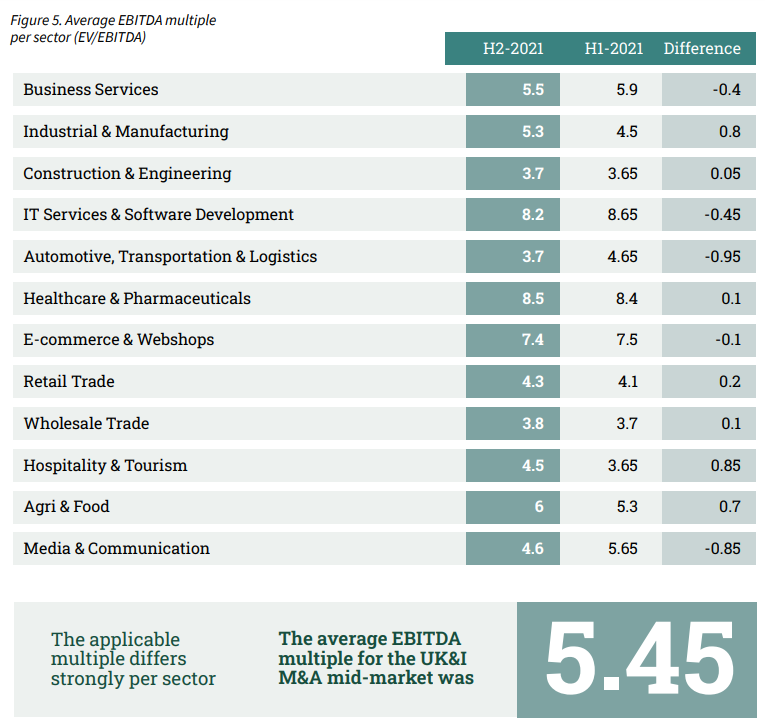
The average multiple is 5.45 with a strong increase in Hospitality & Tourism.
Sell-side advisors defined the average EBITDA multiple by industry. In this edition, we asked to revise the industry multiples from H1-2021. The results are shown in Figure 5.
The average multiple for all sectors decreased slightly from 5.50 in H1-2021 to 5.45 in H2-2021. The average selling price of companies in the United Kingdom and Ireland has declined. Multiples vary between 3.7 (Construction & Engineering) and (Automotive, Transportation & Logistics) and 8.5 (Healthcare & Pharmaceuticals). This means that the average price of an SME varies by more than double, depending on the industry.
In H2-2020 and H1-2021, we saw a clear K-shaped recovery with increases in IT Services & Software Development, Healthcare & Pharmaceuticals and E-commerce, and decreases in the other sectors. With the improving Covid-19 situation, the Hospitality & Tourism sector is recovering with an increase in EBITDA multiple from 3.65 in H1-2021 to 4.5 in H2-2021.
IV Multiples in neighbouring countries
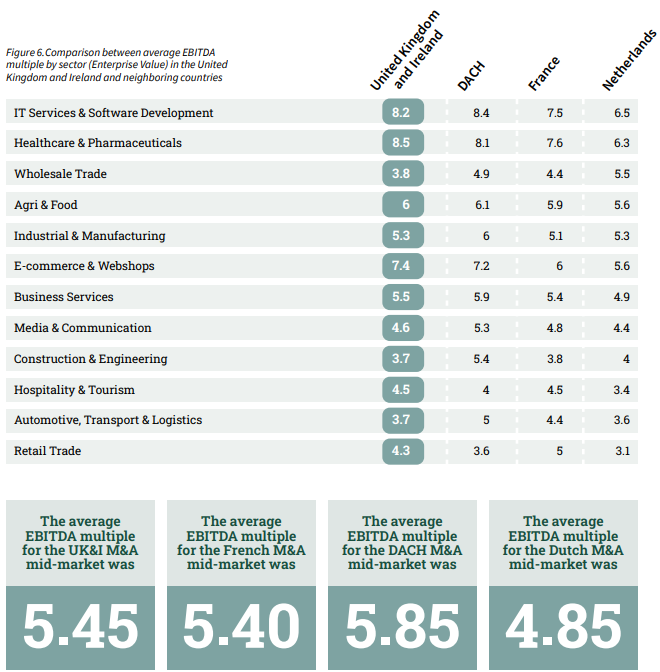
The average EBITDA multiple in The United Kingdom and Ireland is higher than in the Netherlands and France. Companies in the DACH region have a higher multiple.
For this edition of the M&A Monitor, the average EBITDA multiple per sector has once again been examined. This study was carried out with the same methodology in the combination area of the United Kingdom and Ireland, the DACH region, the Netherlands, and in France.
For the first time, this report compares the differences between the multiples in the United Kingdom and Ireland with neighboring countries. Figure 6 shows the EBITDA multiples per sector in the United Kingdom and Ireland compared to the DACH region, the Netherlands and France.
On average, more was paid for an SME located in the United Kingdom and Ireland compared to the DACH region and France.
A noteworthy difference in the average EBITDA multiple was noted between the multiple in the UK&I and the DACH region. The UK&I noted a multiple of 3.7 for an SME in the Construction & Engineering sector, at the same time, a multiple of 5.4 was noted in the DACH region. Companies located in the United Kingdom and Ireland within this sector may benefit from a higher selling price when including foreign acquirers.
The differences in EBITDA multiples are driving cross-border deals. For example, Figure 6 (next page) shows that a company in the Netherlands in the Healthcare & Pharmaceuticals sector was sold at a lower multiple compared to a similar company in the United Kingdom and Ireland. This difference in EBITDA multiples of 2.2 further highlights the benefits of scouting targets abroad (a multiple of 6.3 in the Netherlands compared to a multiple of 8.5 in the United Kingdom and Ireland). In the Retail Trade sector, companies in the Netherlands were sold for a multiple of 3.1. In the United Kingdom and Ireland, an EBITDA multiple of 4.3 is paid for a similar company. Buyers from the United Kingdom and Ireland can benefit from considering foreign targets.
IV Multiples in neighbouring countries
V Motives for selling entrepreneurs
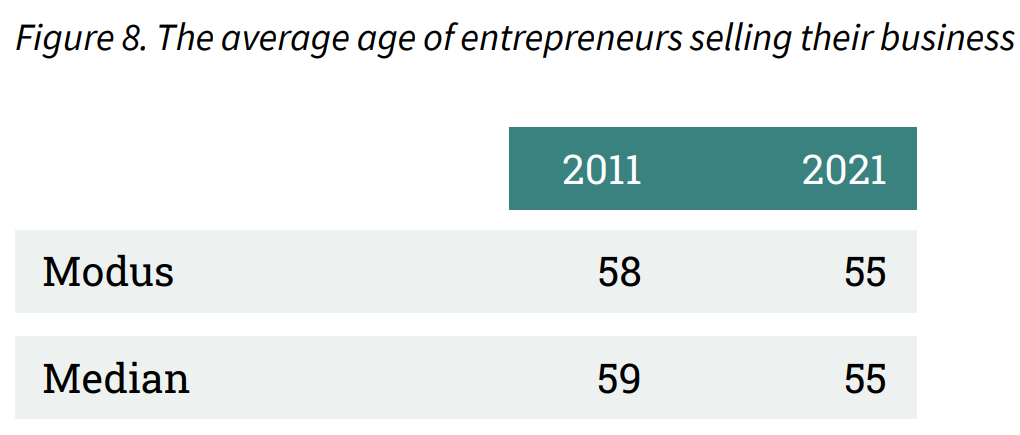
Age is the most common reason for selling a business. The average age of a selling entrepreneur (55) has decreased.
We asked M&A advisory firms about the most common motives for the sale of a business. The following motives in Figure 7 accumulate to 100%.
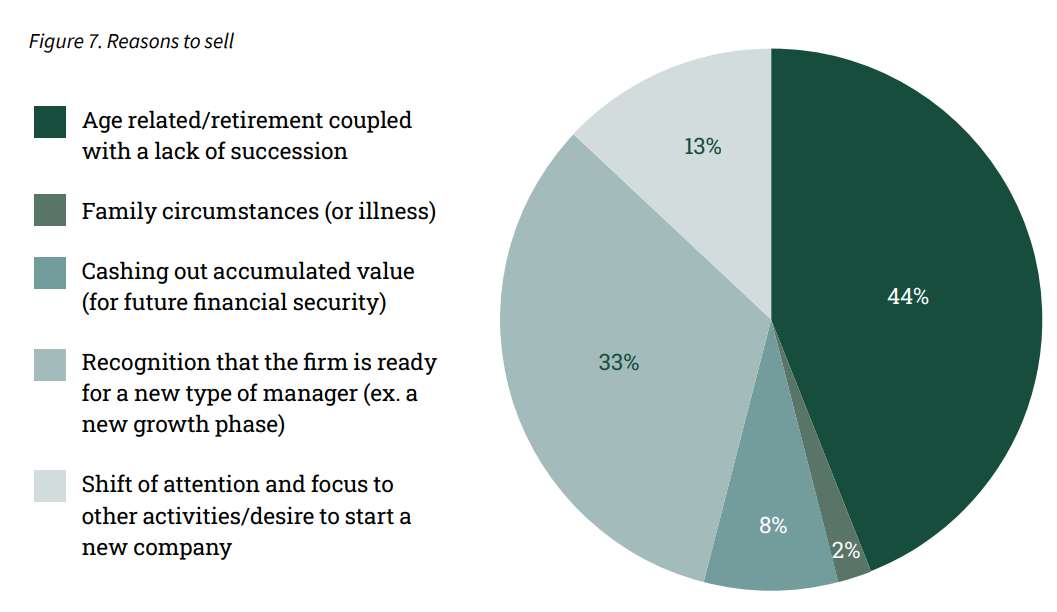
According to M&A advisory firms, age and a lack of succession is the most common motive for the sale of a business with 44%. The recognition that the firm is ready for a new type of manager is the second most common reason for an entrepreneur to sell a business. Over the past 10 years, the average age of a selling entrepreneur has been declining.
VI Duration of sales process
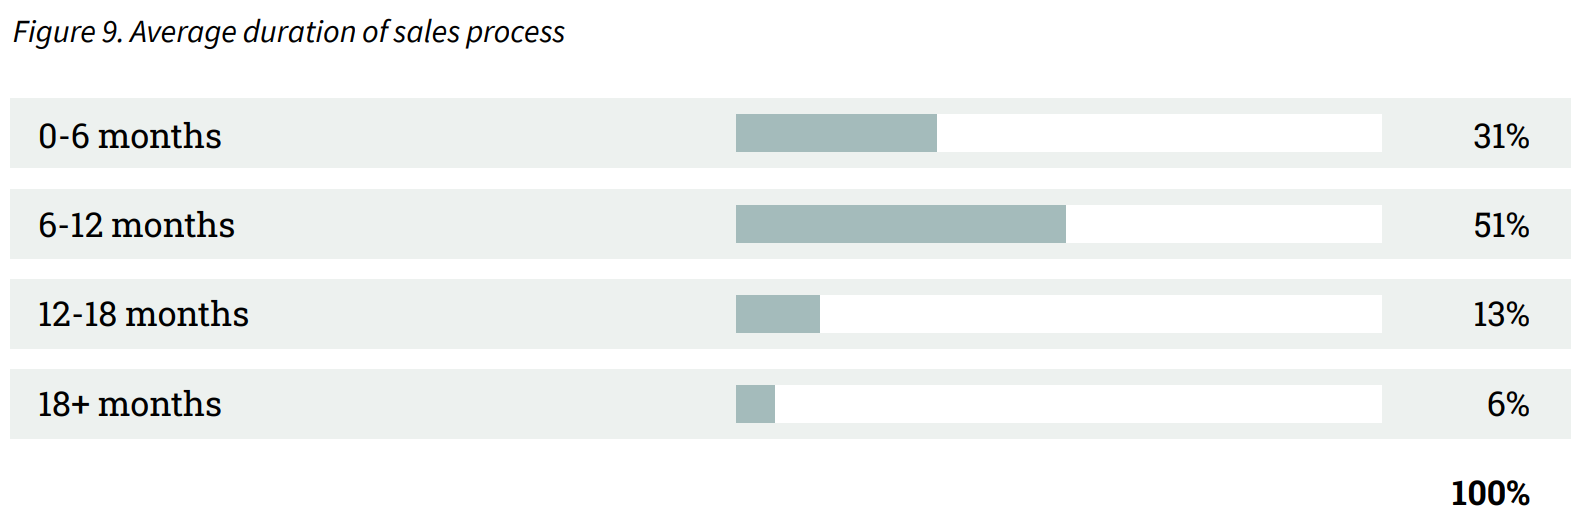
Over half of sales processes have a duration of 6 to 12 months.
The duration of a sales process (from ‘obtaining mandate’ to ‘closing deal’) can vary considerably. The duration of sales processes are divided by percentages over the categories in Figure 9. The vast majority (82%) of sales processes guided by an M&A advisor had a duration of less than 12 months.
VII OUTLOOK
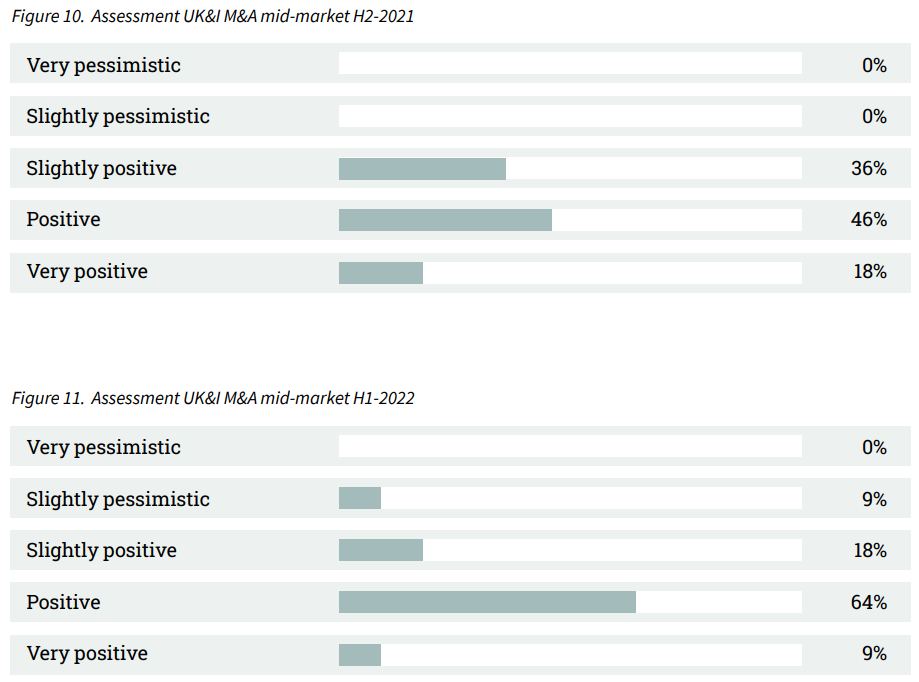
Positive review of H2-2021. All of the surveyed M&A advisors look back at the second half of 2021 with a sense of satisfaction.
Assessing the performance of the UK&I M&A mid-market is based on many factors, including willingness of entrepreneurs to sell their businesses, availability of funding, macroeconomic developments etc. A complex interpretation of these factors is needed to determine how the market will develop. The survey included both assessments of the M&A mid-market in H2-2021 (retrospective) and H1-2022 (projection).
In H2-2020 almost half of the respondents expressed a negative sentiment about the previous half year (46%). This was the year of the start of the Covid-19 crisis. The surveyed advisors had a far more positive reflection on H1-2021 where 91% reported a positive reflection on the previous half year. A significant observation is that in the second half of 2021, all of the respondents expressed a positive sentiment. The outlook for H1-2022 remains positive with 91% of the advisors expressing a positive outlook. Only 9% of advisors expect the M&A market to deteriorate.
VIII Method
The majority of M&A transactions take place in the mid-market. This M&A Monitor uses the definition of a mid-market company as having a revenue between 1 and 200 million pounds. The survey that was the basis for this M&A Monitor was sent to 323 M&A advisory firms. Considering their combined input, they represent an essential part of the M&A mid-market in the UK&I. Out of the total of 323 advisory firms, we received 96 respondents (29,7% response rate).
Sources used:
• 96 survey responses from senior managers of UK&I M&A advisory firms
• Dealsuite M&A Monitors 2015 - 2021
• Dealsuite transaction data 2015-2021
• Field, A. (2011) Discovering Statistics SPSS. Third edition, SAGE publications, London. 1 -822
• Grabowski and Pratt (2013). Cost of Capital: Applications and Examples.
This research was conducted by Jelle Stuij, Bjorn Brenninkmeijer and Roos Bijvoet. For further questions,
please contact David Kiernan or Kai Kinsman.