.svg)

.svg)


.svg)


.svg)

.svg)

.svg)

.svg)

Download the M&A Monitor September 2022
Introduction
Thank you for taking the time to read this H1-2022 version of the UK&I M&A Monitor. This report consolidates research performed by Dealsuite, the leading UK&I and international platform for M&A transactions. It contains statistics and trends for the UK&I M&A mid-market (enterprises with a revenue between £1 million and £200 million) over the first half of 2022.
Dealsuite surveyed 327 M&A advisory firms operating in the UK&I M&A mid-market.
The aim of this study is to create periodic insights that improve the UK&I market’s transparency and to serve as a benchmark for M&A professionals. We are convinced that sharing information within our network leads to an improved quality and volume of deals.
Floyd Plettenberg MSc. EMFC
CEO Dealsuite
I Transactions
Slight increase in the number of buy and sell-side transactions.
The advisors that took part in this research were involved in the following numbers of transactions in the first half of 2022:
Some of the businesses sold involved a respondent on both the sell- and buy- side. Therefore, we cannot sum up the sell- and buy-side transactions to arrive at a total number of transactions.
After the eventful year of 2021, the year 2022 also had a turbulent start. Many Covid restrictions were lifted, which resulted in a recovering M&A market. However, the war in Ukraine and the related increase in inflation and interest rates caused some uncertainty in the market. The increase in inflation and interest rates had a negative effect on the selling prices, but with the significant demand in the market, there has only been a slight decrease in the average paid EBITDA multiple.
After a sharp increase in the number of transactions in 2021, we are now seeing a slowdown in the market. In H1-2022 we still saw a slight increase of 2% in the number of buy-side transactions as well as a small increase of 4% in the number of sell-side transactions.
I Transactions
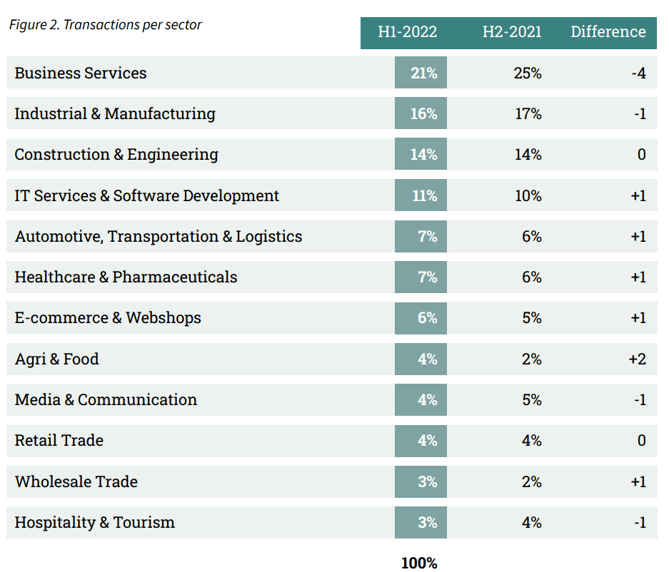
Distribution of transactions over sectors is similar to H2-2021. Percentage of transactions in the Agri & Food sector has doubled.
The distribution of transactions in H1-2022 across the sectors is illustrated in Figure 2. There is a significant drop in the percentage of transactions in the Business Services sector. In H2-2021, 25% of all transactions were closed in this sector. In H1- 2022, this percentage dropped by 4% to a total of 21%.
The percentage of transactions in the Agri & Food sector has doubled from 2% in H2-2021 to 4% in H1-2022. Furthermore, the percentage distribution of transactions in H1-2022 is similar to the distribution of H2-2021 with a maximum difference of 1.
I Transactions
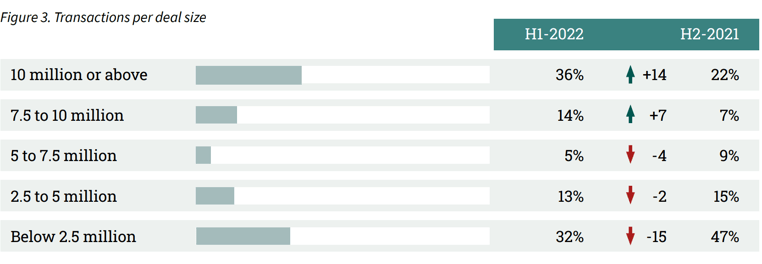
Significant increase in transactions with a deal size of over 10 million.
In H1-2022 the average deal size increased again. In H2-2021 38% of transactions had a deal size of over 5 million. In H1-2022, more than half (55%) of transactions were reported to have a deal size of over 5 million.
II Assignments
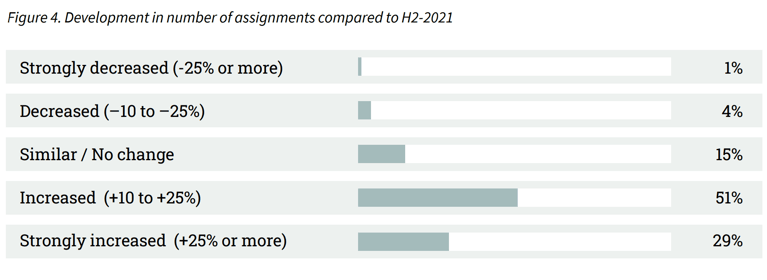
4 out of 5 advisors reported an increase in assignments.
The results are explained in more detail in Figure 4 below. These are assignments received in H1-2022 and completed in H1-2022, but they could also take till H2-2022 to close or may be cancelled altogether.
Only 5% of advisors reported a decrease in the number of assignments. In the previous edition of the M&A Monitor, 74% of advisors reported an increase in assignments. In H1-2022, this increase continues with 80% of advisors reporting an increase in assignments.
III Sector Multiples
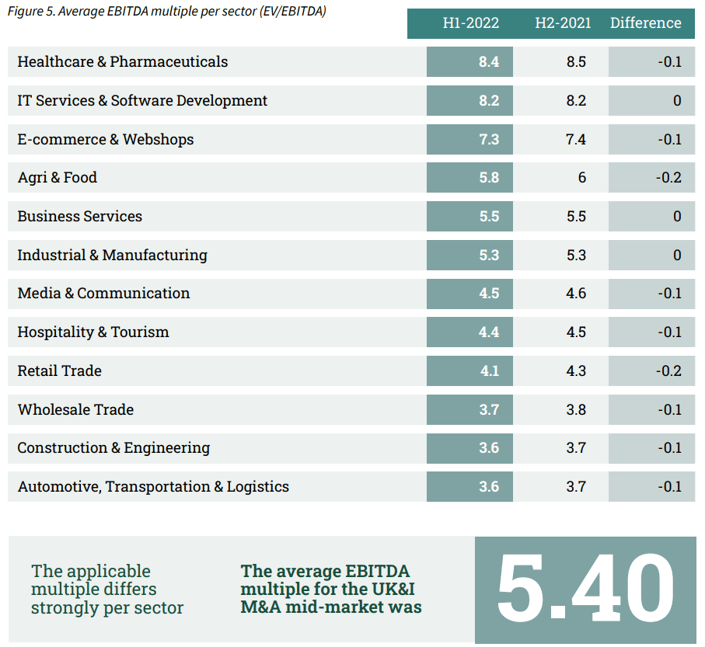
The average EBITDA multiple slightly decreased to 5.40.
Sell-side advisors defined the average EBITDA multiple by industry. In this edition, we asked to revise the industry multiples from H2-2021. The results are shown in Figure 5.
After a small decrease in H2-2021, the average EBITDA multiple for all sectors slightly decreased to 5.40. Multiples vary between 3.6 (Construction & Engineering) and 8.4 (Healthcare & Pharmaceuticals). This means that the average price of an SME varies by more than double, depending on the industry.
Noteworthy is that none of the average EBITDA multiples have increased in the previous half year. The multiples of four sectors remained stable. The biggest decrease in multiples occurred in the Retail Trade and Agri & Food sectors which both decreased by 0.2.
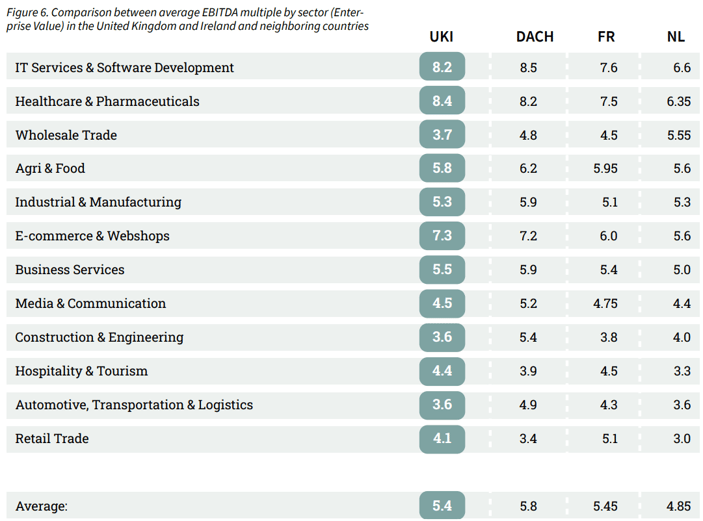
IV Cross-border deals
In the previous edition of the M&A monitor, we compared the average EBITDA-Multiples of the United Kingdom and Ireland with the multiples of other western-european countries. From this comparison, it became clear that cross-border deals can have many advantages. Figure 6 provides an overview of EBITDA-Multiples in the different regions.
One of the most noteworthy differences in average paid EBITDA per sector is in the Healthcare & Pharmaceuticals sector in UK&I compared to the other western-european countries. For example in the Netherlands, where 6.35 times the EBITDA was paid for a similar company. In UK&I, the EBITDA multiple for this sector is 8.4.
Furthermore, another big difference in multiples is seen in the Wholesale Trade sector. In UK&I, an
average of 3.7 times the EBITDA was paid for a company in this sector, whereas in the Netherlands, 5.55 times the EBITDA was paid for a similar company.
IV Cross-border deals
In this edition of the M&A monitor, research has been conducted on the percentage of SME transactions in the United Kingdom and Ireland, in which an international buyer or seller was involved. Furthermore, advisors were asked to express the willingness of their clients to sell to a foreign buyer.
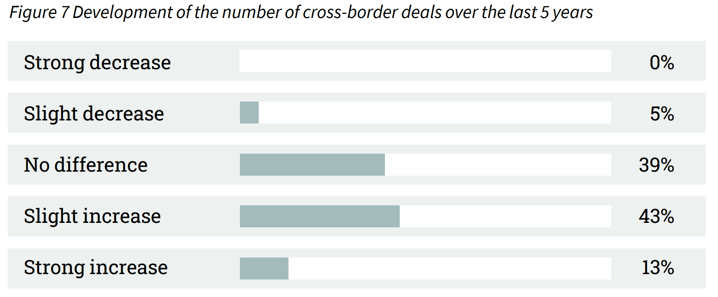
Involving a foreign party in the purchase or sale of a business can bring many benefits. For example, it can result in a higher selling price or in finding a transaction partner with a better fit for the business. Digitalisation has made it easier to establish cross-border transactions. We asked advisors about the development of the number of transactions with a cross-border component over the past five years. The results can be found in Figure 7. Over half of the advisors (56%) indicate that the number of cross-border transactions has increased in the past 5 years. 39% of respondents did not notice a difference in the number of cross-border transactions. Only 5% of the respondents report a decrease.
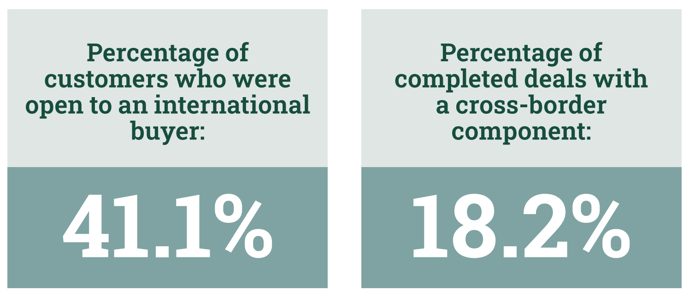
The advisors were also asked to express the percentage of companies that are open to an international buyer. 42.1% of the sellers were open to a cross-border deal in H1-2022. Ultimately, 18.2% of completed transactions in the SME market involved a foreign buyer or seller.
This difference of notional willingness to participate in cross-border transactions and executed deals shows considerable potential for growth in the SME market.
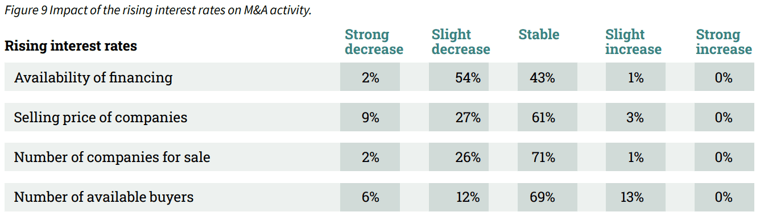
V Inflation and increase in interest rates
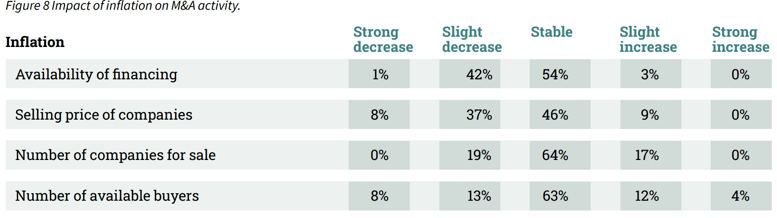
The United Kingdom and Ireland are experiencing the strongest inflation in over 20 years (Statista, 2022). In this edition of the M&A monitor, the advisors were asked to express the impact of the inflation on their M&A activity. The advisors were also asked about the impact of the subsequent increase in interest rates as a result of the new policy of the ECB.
Increases in inflation and interest rates can, among other things, impact the selling price of a business, finance availability, the number of available buyers, and the number of companies offered. The results of this study can be found in Figure 8.
Inflation can impact M&A activities. According to 46% of the advisors, the selling prices of companies are lower because of inflation. The availability of financing also seems to be impacted, with 43% of advisors reporting a decrease in availability. 64%of the respondents reported that inflation did not impact the number of businesses offered.
To suppress the strong inflation, the ECB raised interest rates for the first time in 11 years. We asked advisors about the impact that the increase in interest rates has had on their M&A activities. 56% of the advisors report that the increase causes the availability of financing to decrease. Also, 36% of advisors say that the selling prices are decreasing because of the rising interest rates. 7 out of 10 advisors (71%) report that there is no difference in the amount of companies for sale.
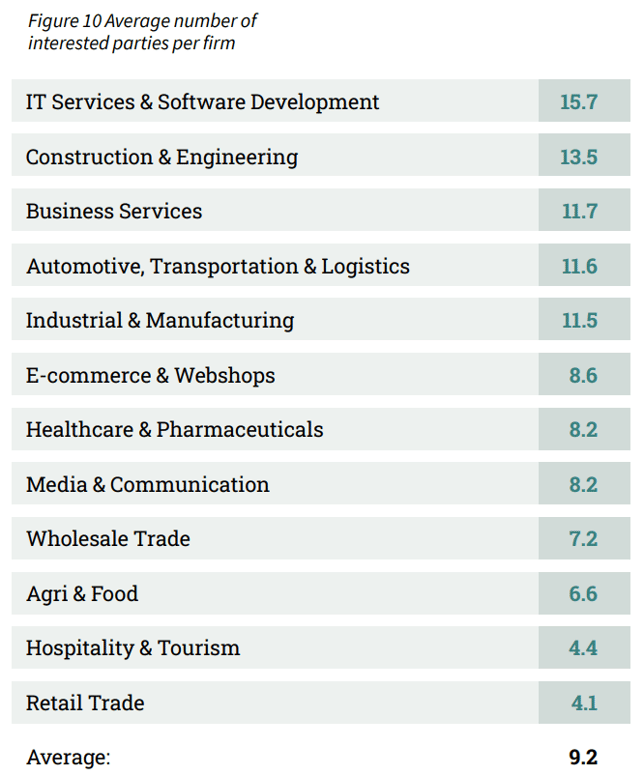
VI Buyer intent per sector
The M&A market is a seller’s market. Demand exceeds supply
The current M&A market is a “seller’s market. The number of interested parties per company is generally high; there is more demand than supply. However, the relationship between supply and demand is different in each sector. Therefore, the respondents were asked to indicate per sector how demand compares to supply. Or, in other words, on average per sector, how many seriously interested parties report to the selling party per company. A “seriously interested person” was defined as one who actually contacts the selling party’s advisor. The results are shown in Figure 10.
The IT Services & Software Development sector has the highest average number of interested parties per company. On average, a company within this sector receives 15.7 interested parties. Companies within the Construction & Engineering sector are also in high demand. A company in this sector on average attracts 13.5 interested parties. Companies in the Retail Trade sector on average attract the fewest interested parties.
In this sector, an average of 4.1 parties earnestly approach the seller. The Hospitality & Tourism sector also has a lower average number of interested parties (4.4).
The average across all sectors is 9.2 interested parties per company. Across the board, it can therefore be said that demand significantly exceeds supply.
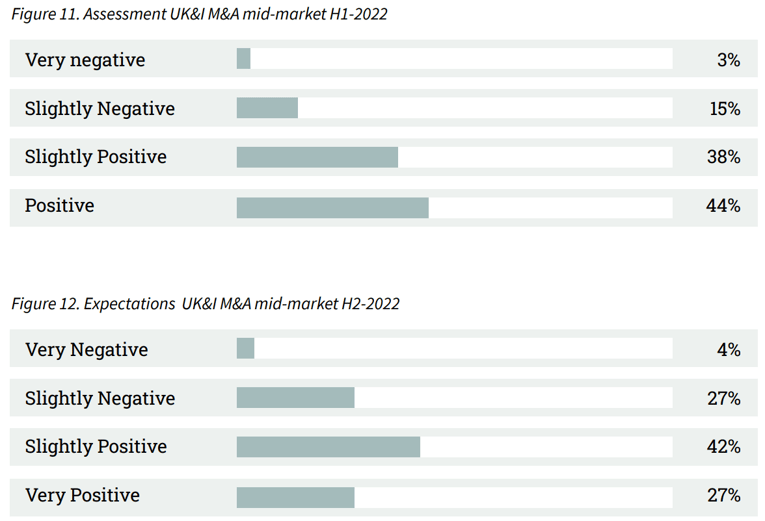
VII Outlook
69% of advisors are optimistic about H2-2022
Assessing the performance of the UK&I M&A mid-market is based on many factors, including the willingness of entrepreneurs to sell their businesses, funding availability, macroeconomic developments etc. A complex interpretation of these factors is needed to determine how the market will develop. The survey included both assessments of the M&A mid-market in H1-2022 (retrospective) and H2-2022 (projection).
The majority of advisors (82%) look back at H1-2022 with a sense of satisfaction. Despite all of the uncertainty in the market, this is a surprisingly high percentage. The expectations for H2-2022 remain on the positive side with the majority of advisors (69%) expressing an optimistic expectation for the months to come, while 31% of the advisors expect the market to deteriorate.
VIII Method
The majority of M&A transactions take place in the mid-market. This M&A Monitor uses the definition of a mid-market company as having a revenue between 1 and 200 million pounds. The survey that was the basis for this M&A Monitor was sent to 327 M&A advisory firms. Considering their combined input, they represent an essential part of the M&A mid-market in the UK&I. Out of the total of 327 advisory firms, we received 92 respondents (28,1% response rate).
Sources used:
• 92 survey responses from senior managers of UK&I M&A advisory firms
• Dealsuite M&A Monitors 2015 - 2022
• Dealsuite transaction data 2015-2022
• Field, A. (2011) Discovering Statistics SPSS. Third edition, SAGE publications, London. 1 -822
• Grabowski and Pratt (2013). Cost of Capital: Applications and Examples.
• Statista. 2022. Inflation rate from 1987 to 2027 | Statista.
This research was conducted by Jelle Stuij, Bjorn Brenninkmeijer and Roos Bijvoet. For further questions, please contact Tariq or Edward.