.svg)

.svg)


.svg)


.svg)

.svg)

.svg)

.svg)


Introduction
Thank you for taking the time to read this third edition of the European M&A Monitor. This report consolidates research performed by Dealsuite, the leading European platform for M&A transactions. It contains statistics and trends for the Western-European M&A mid-market (enterprises with a revenue between €1 million and €200 million) over the second half of 2023.
Dealsuite surveyed 1,330 M&A advisory firms operating in the M&A mid-market of the UK&I, DACH, France and the Netherlands.
The aim of this study is to create periodic insights that improve the European market’s transparency and to serve as a benchmark for M&A professionals. We have been publishing local/regional reports for several years now, this is the third time we publish this pan-European report, with a focus on inter- regional differences, as well as similarities. We are convinced that sharing information within our network leads to an improved quality and volume of deals.
Floyd Plettenberg MSc. EMFC
CEO Dealsuite
I Transactions
Increase in both buy and sell-side transactions reported in 3 out of 4 regions
Figure 1 shows the development of buy and sell-side transactions over H2-2023 compared to H1-2023.
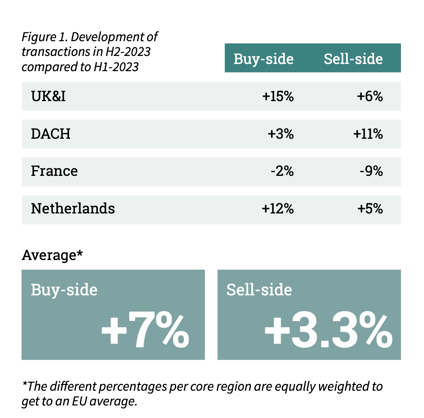
In 2023, the landscape for mergers and acquisitions was significantly shaped by external forces, including a notable surge in interest rates, escalating inflation, and geopolitical tensions, particularly in Ukraine, Russia, and Israel. These factors impacted various aspects such as financing costs and the valuation of businesses. Despite the challenging economic conditions, there was a noticeable uptick in the volume of both buy-side and sell-side transactions in three out of four regions during the second half of 2023. France was the exception, where a decrease in sell-side transactions by 9% and in buy-side transactions by 2% was observed. The United Kingdom and Ireland reported the largest growth in transaction numbers, with buy-side activities increasing by 15%. Another significant growth in buy-side transactions was reported in the Netherlands (+12%). Meanwhile, the DACH region experienced the most significant rise in sell-side transactions, recording an 11% increase.
On average, the buy-side transactions over the four regions increased by 7%. The number of sell-side transactions over the four regions increased by 3.3% on average.
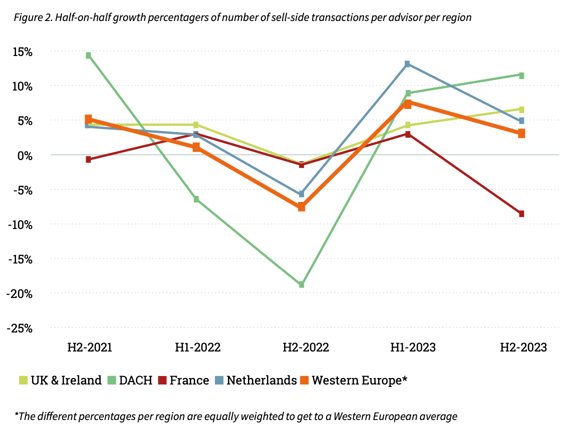
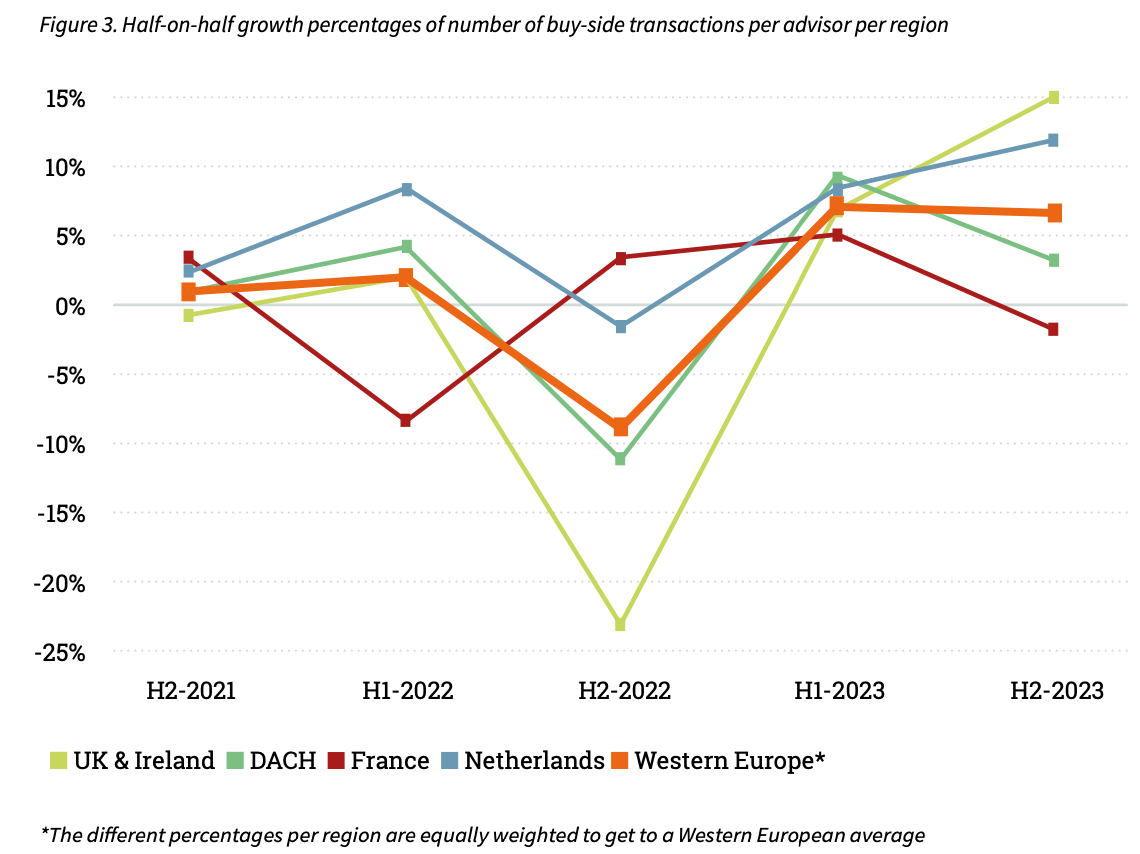
Figures 2 and 3 show the development of the number of buy- and sell-side transactions since the second half of 2021, represented by showing the growth percentages by region half-on-half. At a first glance, it is interesting to observe how similar the development of the number of transactions is in the different regions over the years, except for France to a certain extend. The data presented here, indicates a recovery of the European M&A market in H2-2023 versus H1-2023. Only advisors in France reported a decrease in both buy-side and sell-side transactions in the second half of 2023 versus the first half.
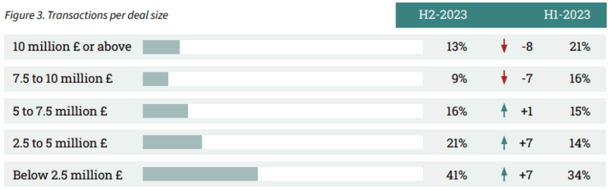
Reduction in Average Transaction Size Recorded in H2-2023.
After a significant increase in the average deal size in H1-2023, the average deal size has decreased again in the second half of 2023. 62% of transactions had a deal size of less than 5 million. The percentage of transactions with a deal size of above 5 million decreased by 14 percentage points to 38%.
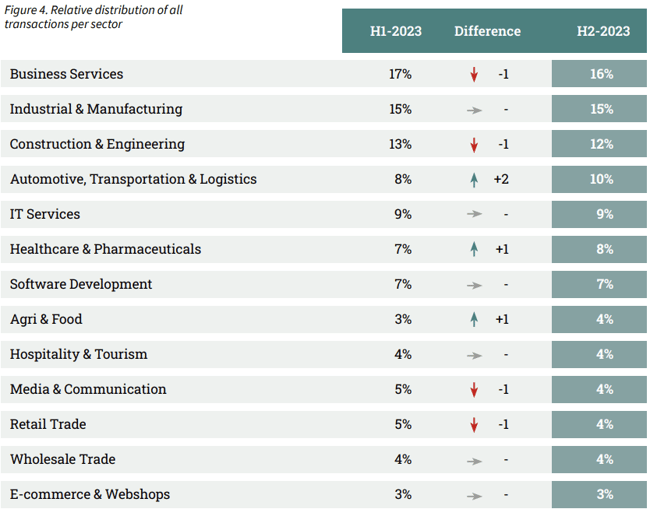
Biggest increase reported in Automotive, Transportation & Logistics sector (+2).
The distribution of transactions completed in H2-2023 across sectors is illustrated in Figure 4. There is a correlation to be expected between the relative size of a specific sector in the mid-market and the percentage of closed transactions. Despite a small drop of 1 percentage point, the most transactions were again closed in the Business Services sector (16%).
When examining the distribution of transactions across the four regions, the most significant discrepancy is observed in the Software Development sector. In the DACH region, 14% of the transactions occurred within this sector, whereas in the other three regions, the percentage was below 6%. In the Netherlands and the UK&I regions, the majority of transactions took place in the Business Services sector. Conversely, in France and the DACH region, the Industry & Production sector saw the highest number of transactions closed.
II Sector Multiples per country
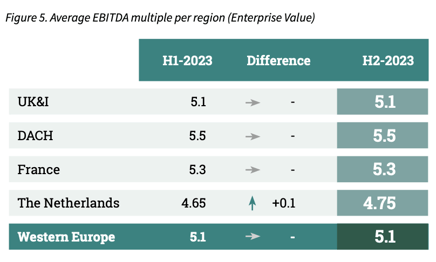
The average EBITDA multiple remains stable at 5.1.
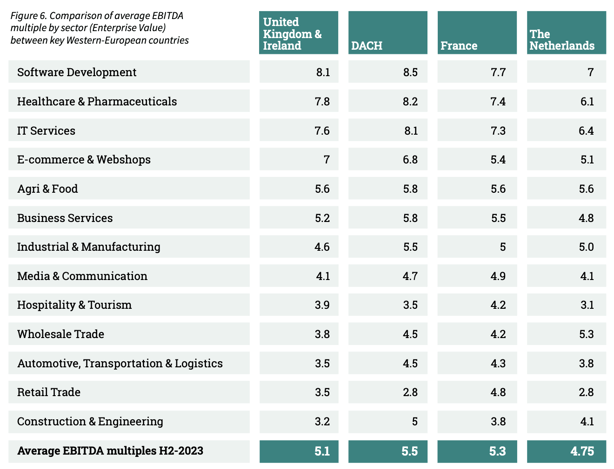
Sell-side advisors defined the average EBITDA multiple by industry. In this edition, we asked to revise the industry multiples from H1-2023. The results are shown in Figures 5 and 6.
After the average European EBITDA multiple had been declining from 5.4 in H1-2022 to 5.1 in H1-2023, the multiple remained stable at 5.1 in H2-2023. The average EBITDA multiples for the UK&I, DACH and France have remained stable in H2-2023, while the average Dutch multiple slightly increased to 4.75.
When comparing the average EBITDA multiples of the various Western-European countries, one can see that involving a foreign party in the purchase or sale of a business could lead to a possible higher selling price.
Across all four regions, the Software Development sector has the highest EBITDA multiple. In the DACH region, companies within this sector are valued at 8.5 times EBITDA, compared to 7 times EBITDA in the Netherlands. More significant differences in multiples are observed in the E-commerce & Webshops sector, with a 1.9 disparity between the UK&I (7 times EBITDA) and the Netherlands (5.1 times EBITDA).
III Multiple comparison per deal size
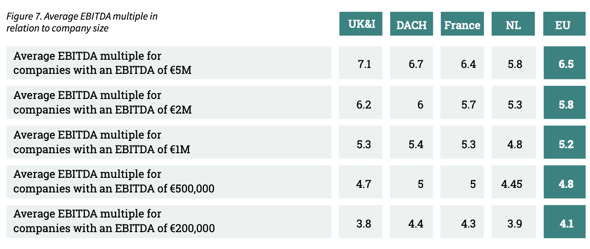
The size of a company can have an influence on the average paid EBITDA multiple. In the M&A Monitors of H1-2021, the impact of the so-called Small Firm Premium on the average EBITDA multiples for SMEs in the various Western-European countries were examined for the first time. Specifically, companies with an EBITDA ranging from €200,000 to €5,000,000 were considered. This EBITDA range is a realistic represen- tation for SMEs in Europe and is therefore used to express the size of a company.
Research has shown that the smaller a company is, the greater the chance that the expected cash flows will not be realised (Damodaran, 2011; Grabowski and Pratt, 2013). The higher risk premium that applies to smaller companies (the so-called Small Firm Premium) causes a value-reducing effect. As a result, the EBITDA multiples paid for larger companies are on average higher than the multiples paid for smaller companies.
The results of the monitor survey confirm again that companies with a low EBITDA have a lower multiple compared to companies with a higher EBITDA. The influence of company size on EBITDA multiples paid is presented in Figure 7.
The biggest difference in EBITDA multiple between companies with a normalised EBITDA of €200,000 and €5,000,000 is reported in the UK&I (3.8 compared to 7.1).
IV Deal Structures
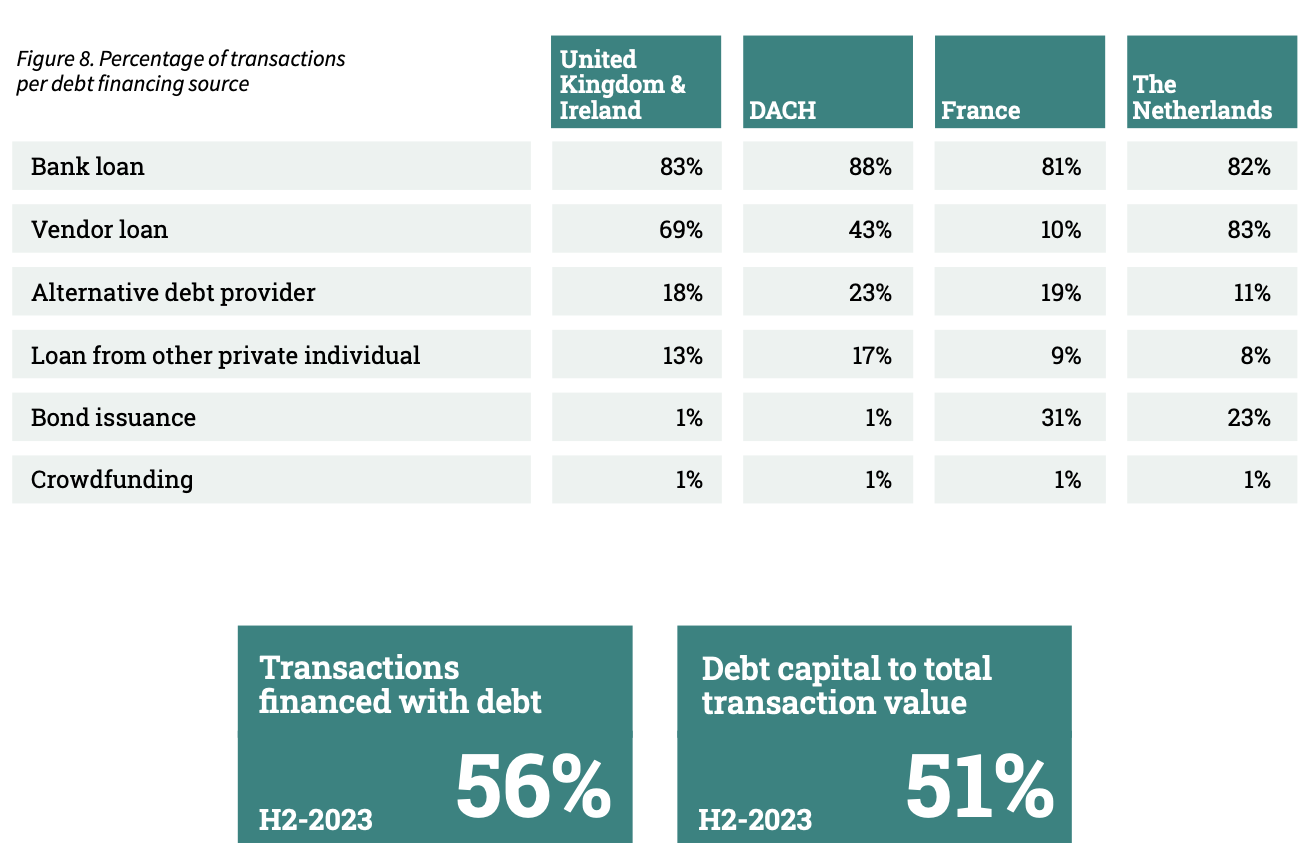
A bank loan was the most common source of financing.
A bank loan was the most common source of financing. Vendor loans were also used in a large percentage of the transactions that involved debt financing, especially in the Netherlands (83%) and the United Kingdom and Ireland (69%). In times of high-interest rates, a vendor loan is an appealing financing option. In France, the vendor loan was a less common source of financing compared to the other regions (10%). In the DACH and UK&I regions, only 1% of debt-financed transactions included bond issuance, whereas in France and the Netherlands, it is a more common source of financing, at 31% and 23%. Crowdfunding was the least common source of financing in all four regions.
V Earn-outs
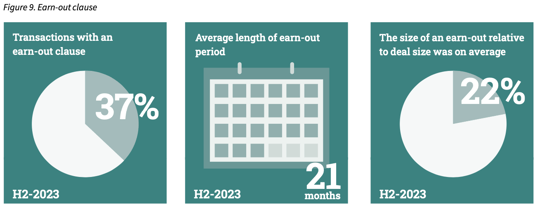
The size of an earn-out relative to deal size was on average 22%.
In transactions featuring earn-out arrangements, a portion of the sale proceeds is contingent on the company’s future performance. This arrangement means the seller doesn’t immediately receive the entire sale price and leave the company. Instead, they remain engaged with the company’s outcomes for a specified period, often including active participation on the board or as an external advisor. Earn-outs allow buyers to reduce the risk of overpaying, while sellers are motivated to ensure a smooth transition of the company.
In the second half of 2023, earn-out arrangements featured in on average 37% of transactions financed with debt. The average duration of earn-out arrangements was 21 months. On average, earn-outs constituted 22% of the deal value.
In the UK&I and France, earn-out arrangements featured in 42% of the debt-financed transactions. This was slightly less in the DACH region (36%) and the Netherlands (28%).
VI Outlook
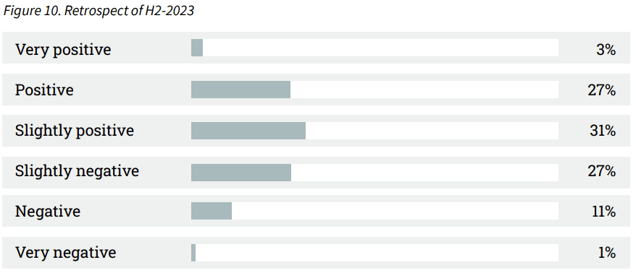
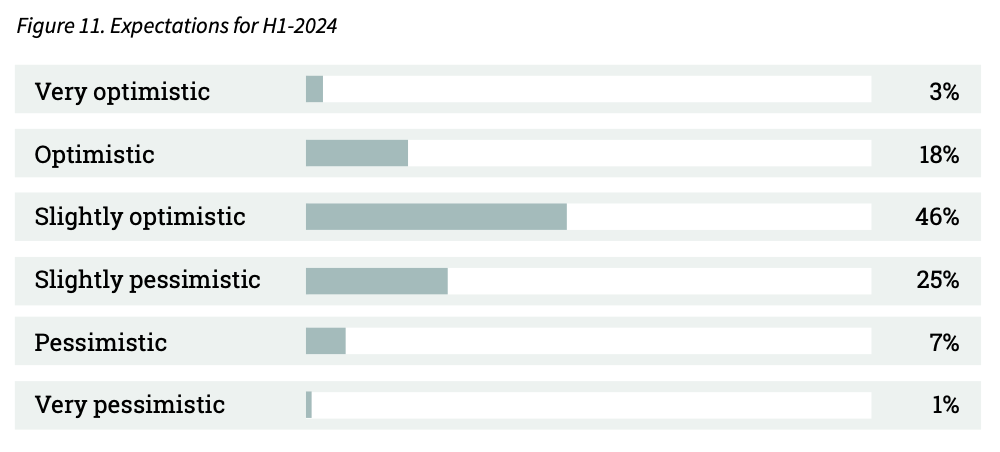
Positive expectations for H1-2024.
Assessing the performance of the Western-European M&A mid-market is based on many factors, including the willingness of entrepreneurs to sell their businesses, funding availability, macroeconomic developments etc. An interpretation of these factors is needed to determine how the market will develop. The survey included both assessments of the M&A mid-market in H2-2023 (retrospective) and H1-2024 (projection).
The majority of advisors look back at H2-2023 with a satisfied feeling (61%). 39% of the advisors are less satisfied with the performance of H2-2023. The expectations for the first half of 2024 are positive, on average, 67% of the advisors have optimistic expectations for the first half of 2024.
The advisors from the UK&I are most optimistic about H1-2024 (77%). Advisors from France have mixed expectations for the first half of 2024, 50% of advisors express optimistic expectations, of which 41% is slightly optimistic. The other 50% is less optimistic about H1-2024. The majority of advisors from the DACH region and the Netherlands are optimistic about H1-2024.
VII Method
The majority of M&A transactions take place in the mid-market. This M&A Monitor uses the definition of a mid-market company as having a revenue between 1 and 200 million euros. The survey that was the basis for this M&A Monitor was sent to 1,330 M&A advisory firms. Considering their combined input, they represent an essential part of the M&A mid-market in Western-Europe. Out of the total of 1,330 advisory firms, we received in total 482 responses (36.2% response rate).
Sources used:
• 482 survey responses from key Western-European M&A advisory firms
• Dealsuite M&A Monitors 2015 - 2023
• Dealsuite transaction data 2015-2023
• Damodaran (2011). Equity Risk Premiums (ERP).
• Graham, J., Harvey, C., Puri, M., 2010. Managerial Attitudes and Corporate Actions.
Working Paper, Duke.
This research was conducted by Casper Maltha and Roos Bijvoet. For further questions, please contact Maarten Reinders, CCO Dealsuite.