.svg)

.svg)

.svg)


.svg)


.svg)

.svg)

.svg)

.svg)


Introduction
Thank you for taking the time to read this H1-2023 version of the UK&I M&A Monitor. This report consolidates research performed by Dealsuite, the leading UK&I and international platform for M&A transactions. It contains statistics and trends for the UK&I M&A mid-market (enterprises with a revenue between £1 million and £200 million) over the first half of 2023.
Dealsuite surveyed 327 M&A advisory firms operating within the UK&I M&A mid-market.
The aim of this study is to create periodic insights that improve the UK&I market’s transparency and to serve as a benchmark for M&A professionals. We are convinced that sharing information within our network leads to an improved quality and volume of deals.
Floyd Plettenberg MSc. EMFC
CEO Dealsuite
I Transactions
Recovery in the number of buy and sell-side transactions.
The advisors that took part in this research were involved in the following number of transactions in the first half of 2023:
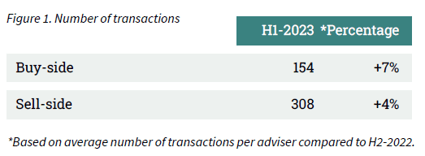
Some of the businesses sold involved a respondent on both the sell- and buy- side. Therefore, we cannot sum up the sell- and buy-side transactions to arrive at a total number of transactions.
The challenging economic situation, caused by rising interest rates and high inflation, resulted in a significant drop in both buy and sell-side transactions in H2-2022. In H1-2023 the number of transactions has started to recover, with an increase of 7% in buy-side transactions reported and an increase of 4% in sell-side transactions.
Largest increase in the sectors Automotive, Transportation & Logistics and IT Services.
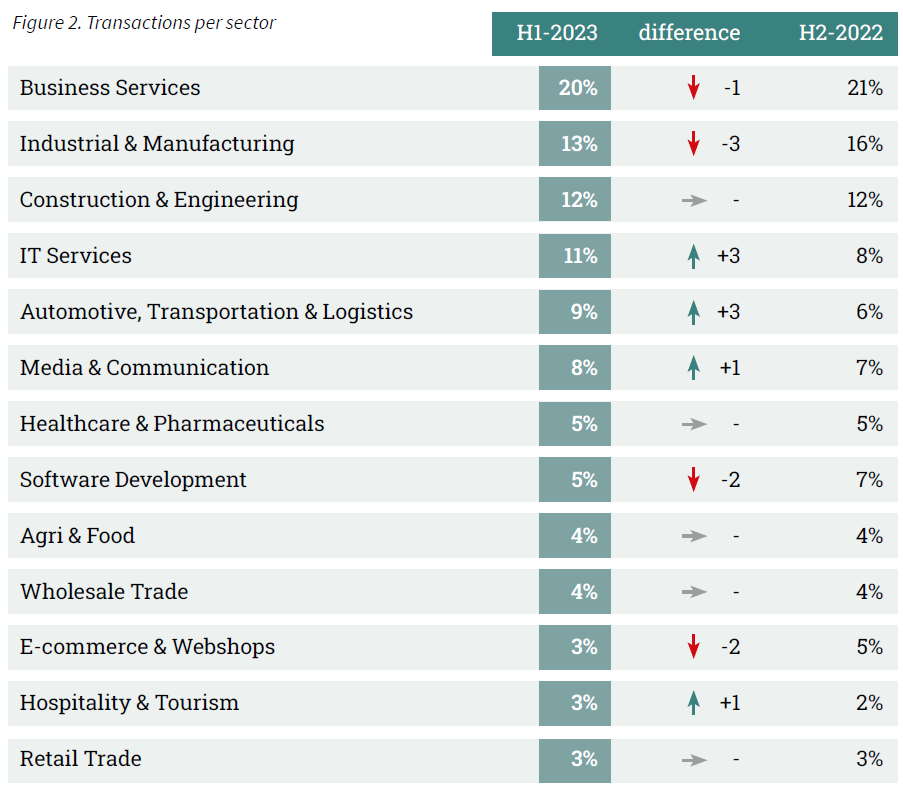
The distribution of transactions completed in H1-2023 across sectors is illustrated in Figure 2. Since the first publication of the UK&I M&A Monitor in H1-2020, most transactions had been closed within the Business Services sector. In H1-2023, the percentage of transactions closed within this sector slightly decreased from 21% to 20%. The percentage of transactions within the Industrial & Manufacturing sector dropped from 16% in H2-2022 to 13% in H1-2023.
The largest increases in the percentage of transactions were reported in the IT Services (11%) and Automotive, Transportation & Logistics sectors (9%). Both percentages increased by 3%.
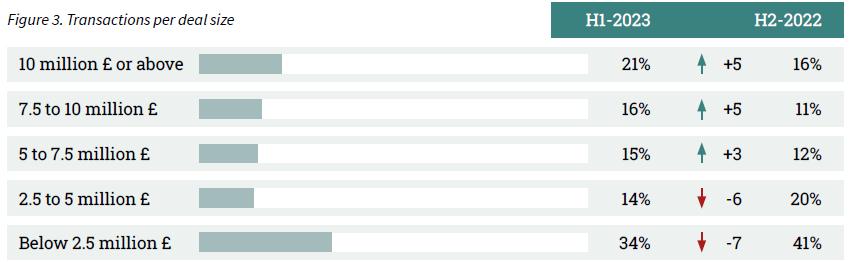
Increase in the average dealsize.
After a decrease in average dealsize in H2-2022, a significant increase in dealsize is reported in H1-2023. The amount of transactions with a dealsize of above 10 million increased from 16% to 21%. In total, the transactions with a dealsize above 5 million increased by 13% to 52%.
II Assignments
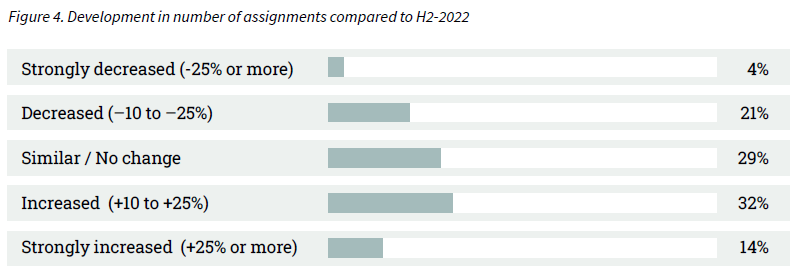
46% of advisors report an increase in the number of assignments.
The results are explained in more detail in Figure 4 below. These are assignments received in H1-2023 and completed in H1-2023. Some of these projects may be completed at a later time or canceled all together.
In H2-2022, the majority of advisors (54%) reported an increase in assignments. In H1-2023, a further increase in the number of assignments was reported by 46% of the advisors. 29% of the advisors reported a similar amount of assignments and the remaining 25% experienced a decrease.
III Sector Multiples
The average EBITDA multiple remains stable at 5.1.
Sell-side advisors defined the average EBITDA multiple by industry. In this edition, the advisors were asked to revise the industry multiples from H2-2022. The results are shown in Figure 5.
Despite the challenging economic circumstances, the average EBITDA multiple for H1-2023 remains stable at 5.1. Individual sectors did note some adjustments. The biggest decrease in EBITDA multiple is reported in the Construction & Engineering sector, where the multiple dropped from 3.3 in H2-2022 to 3.0 in H1-2023. The E-commerce & Webshops, Agri & Food and Wholesale Trade sector multiples slightly increased.
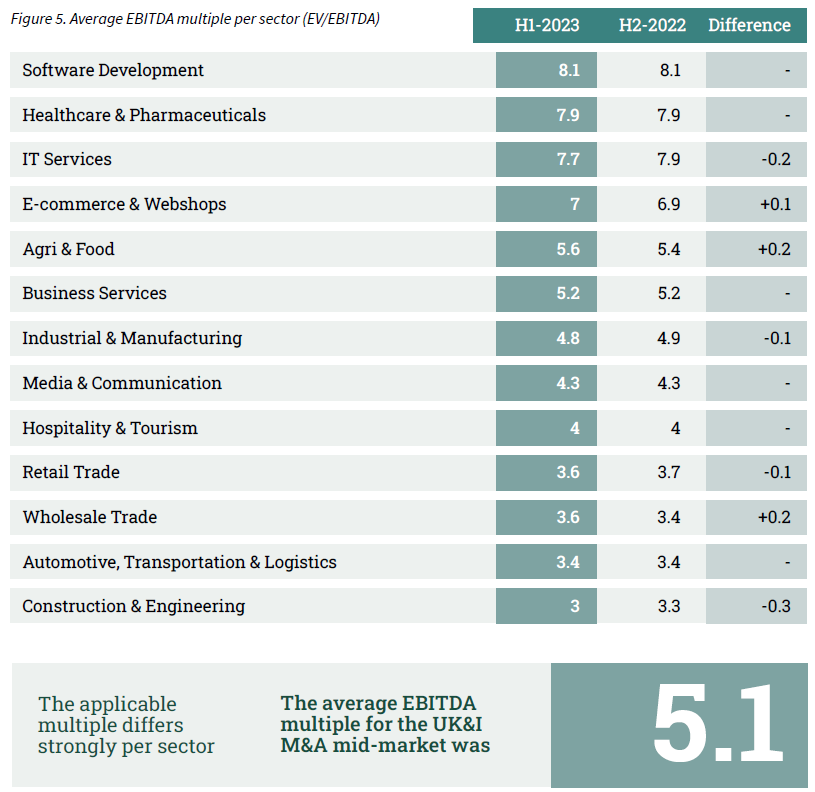
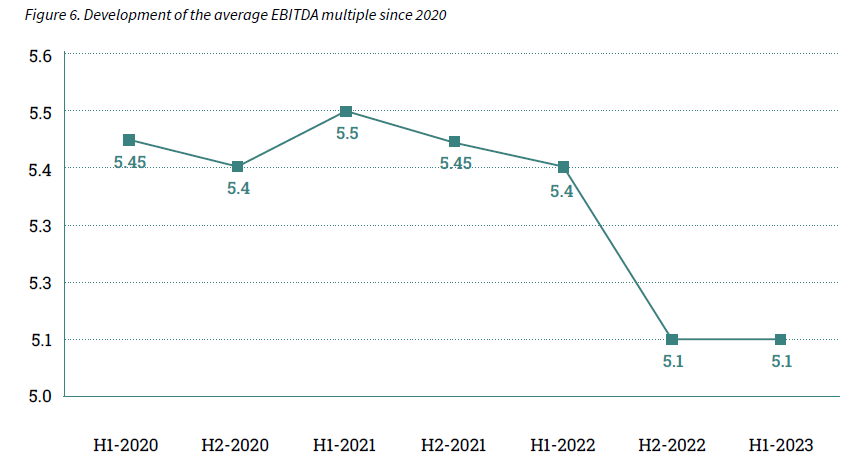
Figure 6 shows the development of the average EBITDA multiple since 2020. In H2-2020, during the pandemic, the average multiple dropped to 5.4. In H1-2021, the multiple reached its highest point at 5.5. Since H2-2021, the multiple has been decreasing to a low of 5.1.
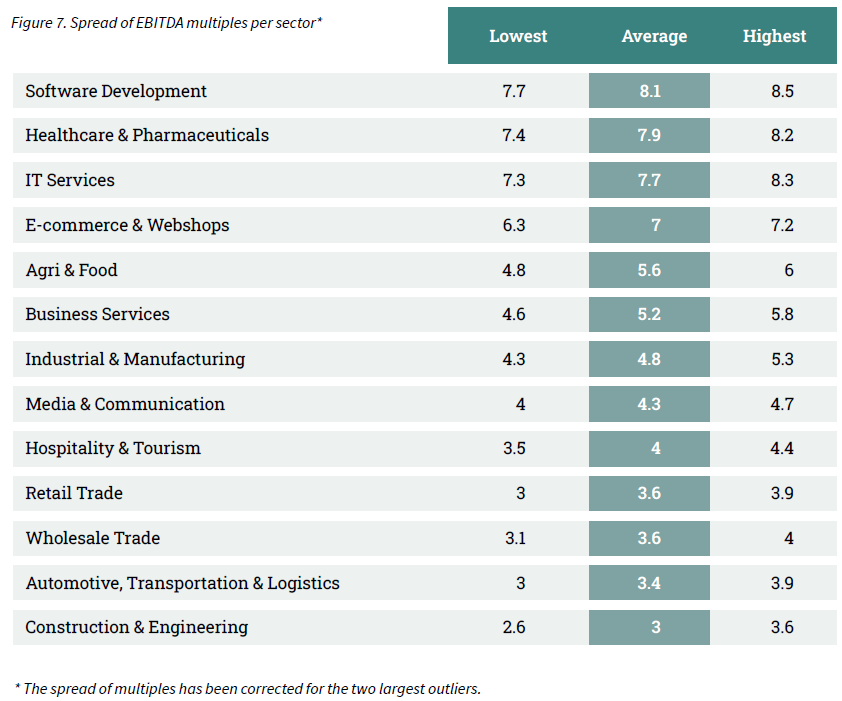
Biggest spread reported in the Agri & Food and Business Services sectors.
A sector can contain various types of companies with different characteristics. As a consequence, businesses in a specific sector may also vary in EBITDA multiple. Figure 7 shows the spread of EBITDA multiples per sector. For some sectors, a wider spread in EBITDA multiples is reported, compared to sectors that contain a higher proportion of similar companies.
IV Cross-border transactions
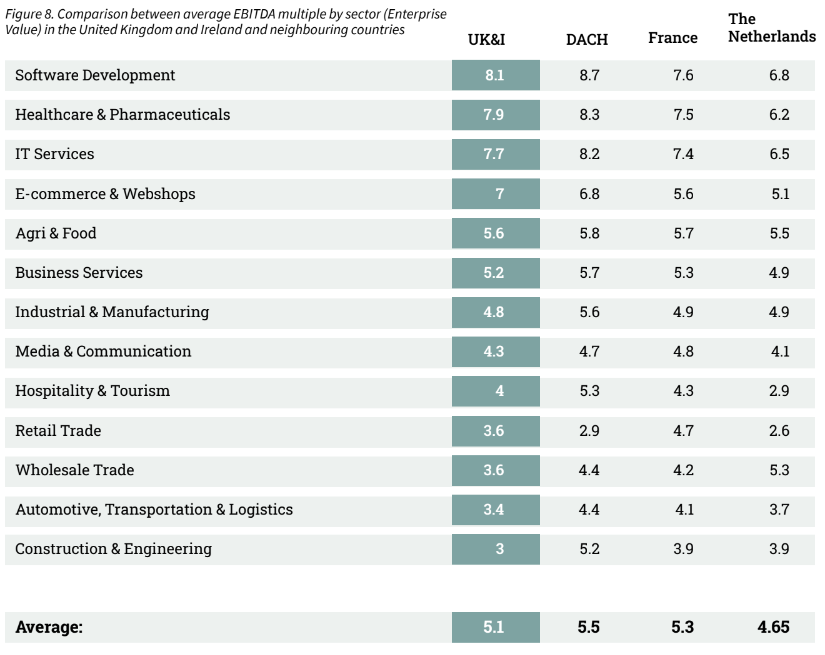
A comparison of EBITDA multiples between different countries highlights the advantages of cross-border deals. For example, it can be beneficial to buy a particular company abroad, or to sell a company to an international buyer. Figure 8 shows the differences in EBITDA multiples between Western European markets.
In all four countries/regions, the highest paid EBITDA multiple is reported in the Software Development sector.
V AI (Artificial Intelligence)
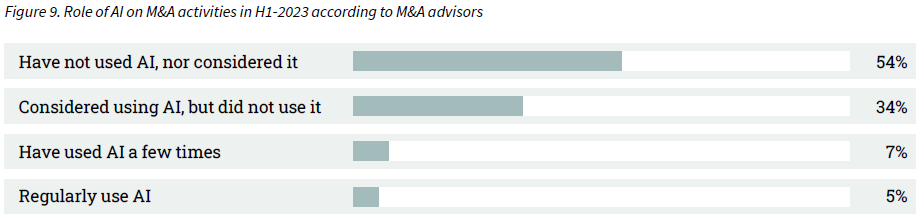
The vast majority of M&A advisors have never used AI to support their M&A activities (88%).
The introduction of AI solutions such as Chat GPT allow for quick access to data and streamlining of tasks. New ways of working deepen understanding of potential deal partners in the broader ecosystem and decrease geographical barriers. Sourcing, screening and scoring deal targets have become a matter of clicks.
5% of the advisors regularly make use of AI to support their M&A activities. The vast majority of M&A advisors have never used AI to support their M&A activities (88%).
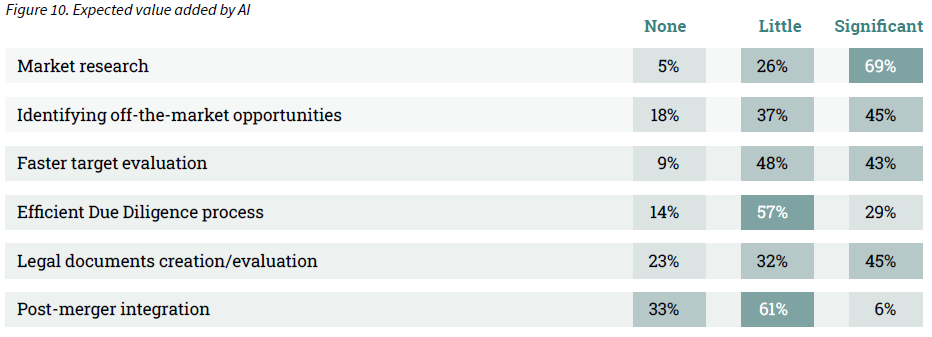
AI can support in various M&A processes from market research to post-merger integration. 69% of M&A advisors agree that AI will add value to the market research process, where only 5% of advisors do not think it will add any value in this process. The opinions on the added value of AI in the Legal documents creation/evaluation process are diverse. 23% of advisors think AI will not add any value in this process, while 45% of advisors believe it will add significant value.
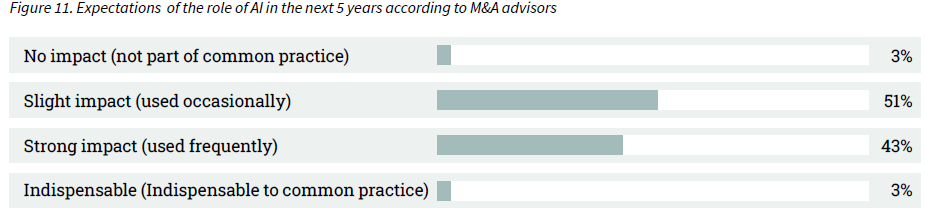
More people become familiar with AI and its benefits. Advisors were asked about how they see the role of AI develop in the upcoming 5 years. The opinions are mixed, 54% of the advisors expect AI to have a slight impact or no impact at all, while 46% of the advisors expect AI to have a strong impact or even be indispensable.
VI Buyers intent
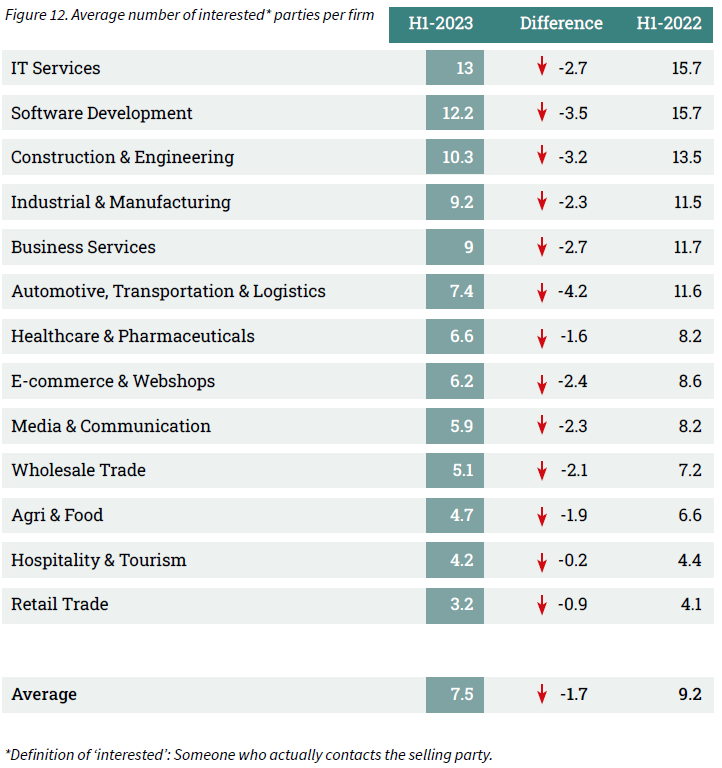
Decrease in average number of interested parties per firm (7.5).
The overall number of interested parties per firm is high. There is more demand than supply. The current M&A market therefore remains a seller’s market. Selling parties are in a luxurious position. The ratio between supply and demand is different for each sector. The advisory firms were asked to fill in the average amount of interested firms per sector. The results are shown in Figure 12. Compared to H1-2022, the average number of interested parties over all sectors has decreased from 9.2 to 7.5.
VII Risk appetite
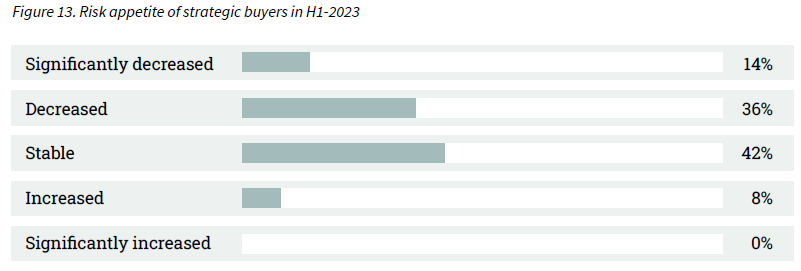
Decrease in the risk appetite of strategic buyers.
In the previous M&A Monitor, research was conducted on which buyer type usually offers the highest price per firm. In 61% of the cases, a strategic buyer made the highest offer. For this edition, M&A advisors were asked about the risk appetite of those strategic buyers in the current challenging economic conditions. Half of the advisors report a drop in the risk appetite of strategic buyers in H1-2023. The risk appetite also impacts the average interested parties per firm (Graham et al. (2010)).
VIII Outlook
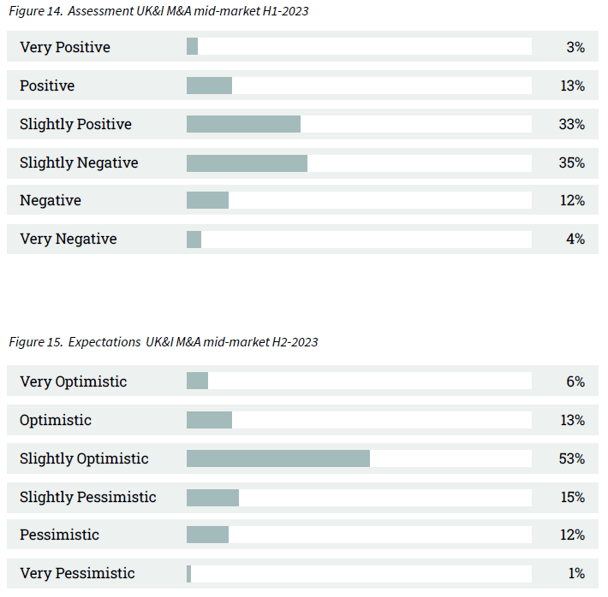
Majority of the advisors (72%) are optimistic about H2-2023.
Assessing the performance of the UK&I M&A mid-market is based on many factors, including the willingness of entrepreneurs to sell their businesses, funding availability, macroeconomic developments etc. An interpretation of these factors is needed to determine how the market will develop. The survey included both assessments of the M&A mid-market in H1-2023 (retrospective) and H2-2023 (projection).
Just like the development of assignments, the opinions about the past six months are mixed. Over half of the advisors (51%) look back at H1-2023 with a dissatisfied feeling. In total, 49% of advisors were satisfied with the performance of H1-2023. The expectations for the second half of 2023 are more positive, 72% of the advisors have optimistic expectations for H2-2023.
IX Method
The majority of M&A transactions take place in the mid-market. This M&A Monitor uses the definition of a mid-market company as having a revenue between 1 and 200 million pounds. The survey that was the basis for this M&A Monitor was sent to 327 M&A advisory firms. Considering their combined input, they represent an essential part of the M&A mid-market in the UK&I. Out of the total of 327 advisory firms, we received 104 respondents (31.8% response rate).
Sources used:
• 104 survey responses from senior managers of UK&I M&A advisory firms
• Dealsuite M&A Monitors 2015 - 2023
• Dealsuite transaction data 2015-2023
• Field, A. (2011) Discovering Statistics SPSS. Third edition, SAGE publications, London. 1 -822
• Grabowski and Pratt (2013). Cost of Capital: Applications and Examples.
• Damodaran (2011). Equity Risk Premiums (ERP).
• Graham, J., Harvey, C., Puri, M., 2010. Managerial Attitudes and Corporate Actions. Working Paper, Duke.
This research was conducted by Jelle Stuij, Bjorn Brenninkmeijer and Roos Bijvoet. For further questions, please contact Tariq Mooseajee or Edward Playfair.