.svg)

.svg)

.svg)


.svg)


.svg)

.svg)

.svg)

.svg)


Introduction
Thank you for taking the time to read this H2-2023 version of the UK&I M&A Monitor. This report consolidates research performed by Dealsuite, the leading UK&I and international platform for M&A transactions. It contains statistics and trends for the UK&I M&A mid-market (enterprises with a revenue between £1 million and £200 million) over the second half of 2023.
Dealsuite contacted 329 M&A advisory firms operating within the UK&I M&A mid-market.
The aim of this study is to create periodic insights that improve the UK&I market’s transparency and to serve as a benchmark for M&A professionals. We are convinced that sharing information within our network leads to an improved quality and volume of deals.
Floyd Plettenberg MSc. EMFC
CEO Dealsuite
I Transactions
Further Increase in the Number of Buy- and Sell-side Transactions.
The advisors that took part in this research were involved in the following number of transactions in the second half of 2023:
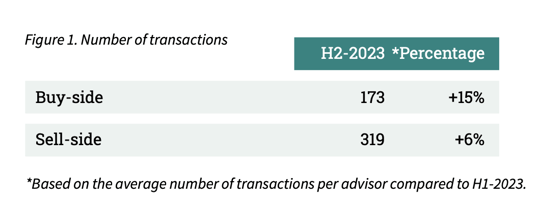
Some of the businesses sold involved a respondent on both the sell- and buy- side. Therefore, we cannot sum up the sell- and buy-side transactions to arrive at a total number of transactions.
In 2023, the economic climate for mergers and acquisitions was strongly influenced by external factors such as the high rise in interest rates, rising inflation and geopolitical conflicts, including the situations in Ukraine, Russia and Israel. All this affected, for instance, financing costs and business valuations. Despite the turbulent economic environment, the number of buy and sell-side transactions continued to increase in H2-2023 compared to the first half of the year. In fact, the number of buy-side transactions increased by 15%. The number of sell-side transactions increased by 6%.
Greatest Increase Seen in Healthcare & Pharmaceuticals and IT-Services Sectors.
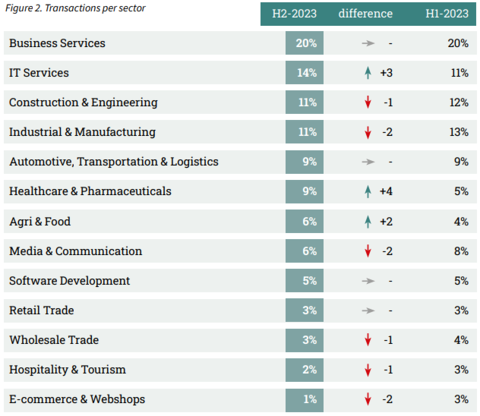
The distribution of transactions completed in H2-2023 across sectors is illustrated in Figure 2. The Business Services sector once again led in transaction closures, accounting for 20% of the total. Notably, the IT-Services sector saw a significant uptick in transactions. In the first half of 2023, this sector represented 11% of transactions, which then increased by 3 percentage points to 14%. Another significant increase was reported in the Healthcare & Pharmaceuticals sector, where the transaction share increased from 5% in H1-2023 to 9% in H2-2023. Conversely, the E-commerce & Webshops sector saw a decrease in transaction share, dropping from 3% to 1%, making it the sector with the fewest transactions.
Reduction in Average Transaction Size Recorded in H2-2023.
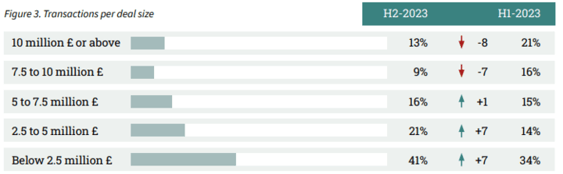
After a significant increase in the average deal size in H1-2023, the average deal size has decreased again in the second half of 2023. 62% of transactions had a deal size of less than 5 million. The percentage of transactions with a deal size of above 5 million decreased by 14 percentage points to 38%.
II Assignments
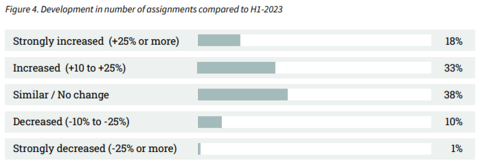
51% of Advisors Report an Increase in the Number of Assignments.
The results are explained in more detail in Figure 4 below. These are assignments received in H2-2023 and completed in H2-2023, however, it is worth noting that some of these projects may be completed during a later period or cancelled.
In H2-2023, 51% of advisors report an increase in the number of assignments received. 38% of the advisors did not note any change in the number of assignments. 11% of advisors report a decrease.
III Sector Multiples
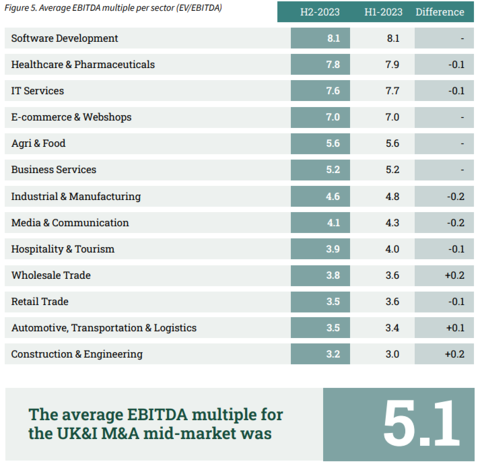
The Average EBITDA Multiple Again Remains Stable at 5.1.
Sell-side advisors defined the average EBITDA multiple by industry. In this edition, the advisors were asked to revise the industry multiples from H1-2023. The results are shown in Figure 5.
After a decrease in average EBITDA multiple from 5.3 to 5.1 in H2-2022, the multiple has remained stable at 5.1. The average EBITDA multiples per sector did change across sectors. For instance, the multiple within the Industrial & Manufacturing sector dropped from 4.8 to 4.6, while the Construction & Engineering sector noted an increase from 3 to 3.2.
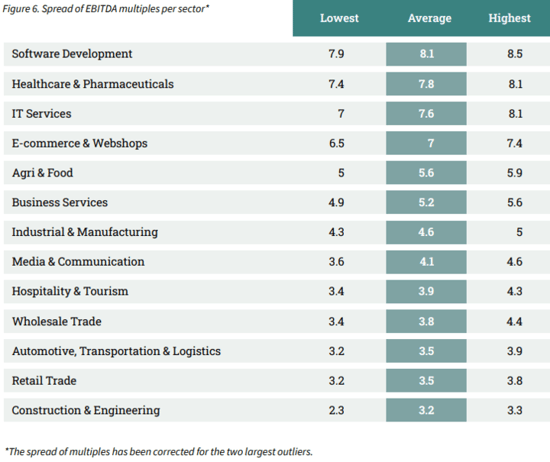
Biggest Spread Reported in the IT Services sector.
A sector can contain various types of companies with different characteristics. As a consequence, businesses in a specific sector may also vary in EBITDA multiple. Figure 6 shows the spread of EBITDA multiples per sector. For some sectors, a wider spread in EBITDA multiples is reported, compared to sectors that contain a higher proportion of similar companies.
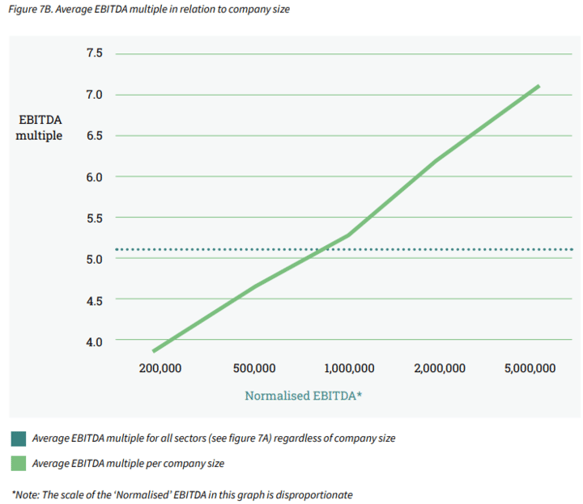
IV Multiples in Relation to Company Size
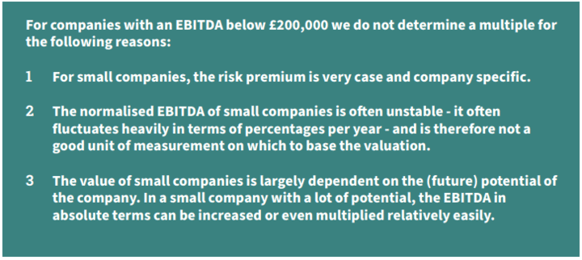
Big Difference Between Multiples for Large and Small Companies.
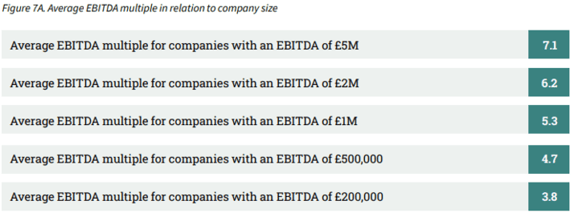
The size of a company can have an influence on the average paid EBITDA multiple. In the M&A Monitor of H1-2021, the impact of the so-called Small Firm Premium on the average EBITDA multiples for SMEs in the United Kingdom was examined for the first time. Specifically, companies with an EBITDA ranging from £200,000 to £5,000,000 were considered. This EBITDA range is a realistic representation for SMEs in the United Kingdom and Ireland and is therefore used to express the size of a company.
Research has shown that the smaller a company is, the greater the chance that the expected cash flows will not be realised (Damodaran, 2011; Grabowski and Pratt, 2013). Consider, for example, the dependency on certain customers or suppliers, or the dependency on specific technical know-how that can quickly diminish when staff leave. This can have a significant impact on the returns and thus on the value of a company. The higher risk premium that applies to smaller companies (the so-called Small Firm Premium) causes a value-reducing effect. As a result, the EBITDA multiples paid for larger companies are on average higher than the multiples paid for smaller companies.
The results of this monitor survey confirm again that companies with a low EBITDA have a lower multiple than companies with a high EBITDA. The influence of company size on EBITDA multiples paid is presented in Figures 7A and 7B.
The difference in the EBITDA multiple between companies with a normalised EBITDA of £200,000 and £5,000,000 is 3.3 (3.8 compared to 7.1).
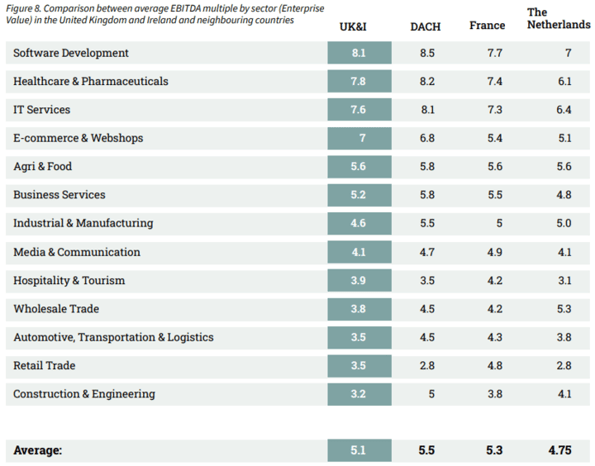
V Cross-Border Transactions
A comparison of EBITDA multiples between different countries highlights the advantages of cross- border deals. For example, it can be beneficial to buy a particular company abroad, or to sell a company to an international buyer. Figure 8 shows the differences in EBITDA multiples between Western European markets.
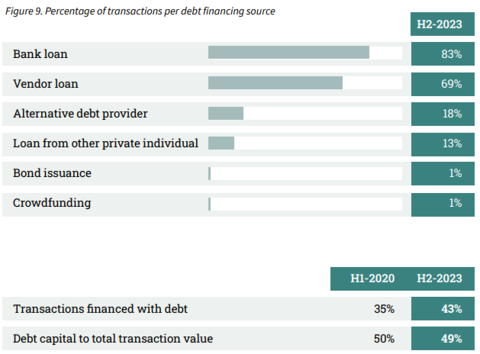
VI Deal Structures
In H2-2023, 43% of Deals were Financed with Debt.
When a transaction is financed with debt, it is common practice to employ a combination of financing methods. During the second half of 2023, 43% of transactions incorporated some form of debt financing compared to 35% in H1-2020. A bank loan was the most common source of financing. Vendor loans were used in 69% of the transactions that involved debt financing. In times of high interest rates, a vendor loan is an appealing financing option. Crowdfunding was used in only 1% of the transactions.
VII Earn-Out
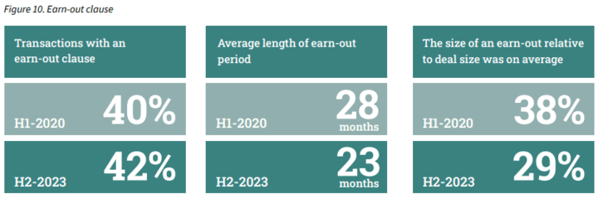
Decrease in Average Length of Earn-out Period.
In transactions featuring earn-out arrangements, a portion of the sale proceeds is contingent on the company’s future performance. This arrangement means the seller doesn’t immediately receive the entire sale price and leave the company. Instead, they remain engaged with the company’s outcomes for a specified period, often including active participation on the board or as an external advisor. Earn-outs allow buyers to reduce the risk of overpaying, while sellers are motivated to ensure a smooth transition of the company.
In 2020, earn-out arrangements featured in 40% of transactions financed with debt. By the second half of 2023, this percentage slightly rose to 42%. In the first half of 2020, the average duration of earn-out arrangements was 28 months. By the second half of 2023, this average decreased to 23 months. On average, earn-outs constituted 29% of the deal value compared to 38% in H1-2020.
VIII Outlook
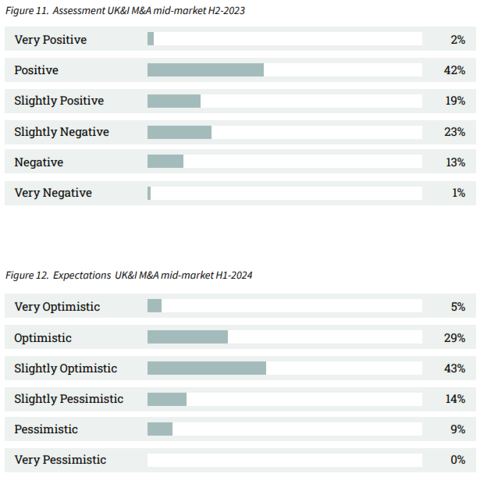
77% of the Advisors have a Positive Outlook for H1-2024.
Assessing the performance of the UK&I M&A mid-market is based on many factors, including the willingness of entrepreneurs to sell their businesses, funding availability, macroeconomic developments etc. An interpretation of these factors is needed to determine how the market will develop. The survey included both assessments of the M&A mid-market in H2-2023 (retrospective) and H1-2024 (projection).
37% of advisors look back at H2-2023 with an unsatisfied feeling, while the majority of advisors look back at the same period with a positive feeling. The outlook for H1-2024 looks promising, 77% of advisors are optimistic about the first half of 2024.
IX Method
The majority of M&A transactions take place in the mid-market. This M&A Monitor uses the definition of a mid-market company as having a revenue between 1 and 200 million pounds. The survey that was the basis for this M&A Monitor was sent to 329 M&A advisory firms. Considering their combined input, they represent an essential part of the M&A mid-market in the UK&I. Out of the total of 329 advisory firms, we received 102 responses (31% response rate).
Sources used:
• 102 survey responses from senior managers of UK&I M&A advisory firms
• Dealsuite M&A Monitors 2015 - 2023
• Dealsuite transaction data 2015-2023
• Field, A. (2011) Discovering Statistics SPSS. Third edition, SAGE publications, London. 1 -822 • Grabowski and Pratt (2013). Cost of Capital: Applications and Examples.
• Damodaran (2011). Equity Risk Premiums (ERP).
• Graham, J., Harvey, C., Puri, M., 2010. Managerial Attitudes and Corporate Actions. Working Paper, Duke.
This research was conducted by Jelle Stuij, and Roos Bijvoet. For further questions, please contact Tariq Mooseajee.